Oppenheimer věří, že vývoj tržeb Microsoftu v oblasti umělé inteligence bude stále více přitahovat investory, protože růst Azure zůstává silný. Cloudová platforma nejen posiluje ocenění Microsoftu – podobně jako AWS v případě Amazonu – ale také nabízí významný potenciál růstu díky rychlému nárůstu tržeb v oblasti umělé inteligence. Společnost považuje Microsoft za dlouhodobého lídra v oblasti softwaru pro umělou inteligenci, přičemž jeho akcie zatím plně neodrážejí potenciál udržitelného růstu v oblasti umělé inteligence ani zrychlení výkonu Azure do fiskálního roku 2026.
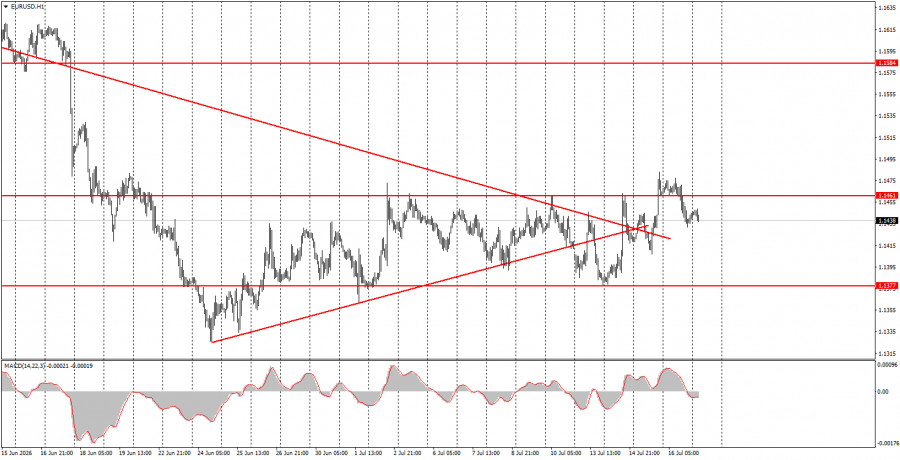
The EUR/USD currency pair showed no interesting movements during Thursday's trading. Earlier, the European currency demonstrated decent growth, and two days prior, it also rose well. Over these two days, the euro gained about 100 pips, which is quite good. However, there is no rationale for this movement, as the pair remains in a weak upward trend bordering on a flat condition. Essentially, what we have been observing for several weeks is a flat. The price spends 98% of the time between 1.1377 and 1.1461. Although there is formally an upward trend in the market, there were no notable publications or events in the European Union yesterday, while U.S. reports prompted a slight increase in the dollar, as they did not underperform market expectations. However, the reports themselves were secondary, so we did not see strong movements again. For the past three weeks, there has not only been a flat in the EUR/USD pair, but volatility has remained extremely low.
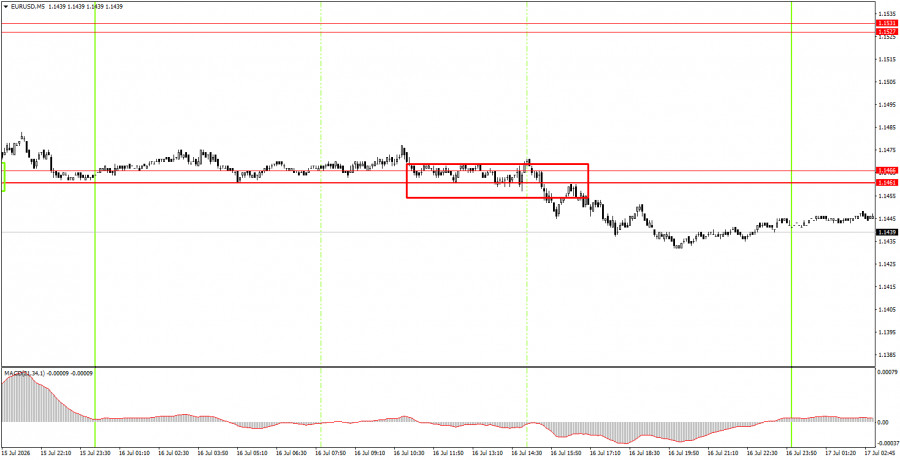
On the 5-minute timeframe, only one trading signal was formed on Thursday. For several hours, under minimal volatility, the price attempted to break through the area of 1.1461-1.1466, eventually succeeding. Naturally, we did not see a strong downward movement after the signal was formed, but the price moved about 15 pips downwards.
On the hourly timeframe, both trend lines have been broken and are no longer relevant. The flat may be coming to an end, as the pair has surpassed the 1.1461 level. Considering all the market events and movements over the past months, we believe the euro should continue to rise – and much more strongly than it currently is. However, in fact, the current upward movement is a correction. After the correction, a new trend phase begins...
On Friday, novice traders may remain in short positions targeting 1.1363-1.1377, as the price has consolidated below the area of 1.1461-1.1466. Long positions may be opened with a target of 1.1527-1.1531 if the price consolidates above the area of 1.1461-1.1466. We still would not expect strong movements.
On the 5-minute timeframe, levels to consider include 1.1267-1.1275, 1.1363-1.1377, 1.1461-1.1466, 1.1527-1.1531, 1.1584-1.1594, 1.1655-1.1666, and 1.1745-1.1754. On Friday, the European Union will release the second estimate of June inflation, which is of little interest. In the U.S., data on the housing market will also be published, along with the University of Michigan's consumer sentiment index, which is not among the most significant reports.
Price levels (areas) of support and resistance are targets when opening long or short positions or sources of signals.
Red lines indicate channels or trend lines that display the current trend and indicate the preferred direction for trading.
The MACD indicator (14,22,3) – histogram and signal line – is a supplementary indicator that can also be used as a source of signals.
Important speeches and reports (contained in the news calendar) can significantly impact the movement of the currency pair. Therefore, during their release, trading should be conducted with maximum caution, or one should exit the market to avoid sharp reversals against preceding movements.
Beginners trading in the forex market should remember that not every trade can be profitable. Developing a clear strategy and practicing money management are key to long-term success in trading.

QUICK LINKS
ForexMart is authorized and regulated in various jurisdictions.
(Reg No.23071, IBC 2015) with a registered office at First Floor, SVG Teachers Co-operative Credit Union Limited Uptown Building, Corner of James and Middle Street, Kingstown, Saint Vincent and the Grenadines
Restricted Regions: the United States of America, North Korea, Sudan, Syria and some other regions.








 Contact Us