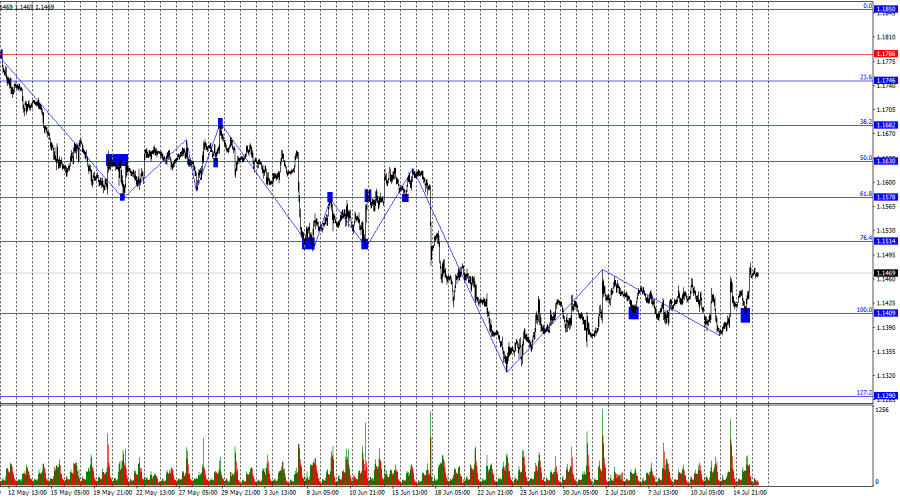
On the hourly chart, EUR/USD rebounded from the 100.0% Fibonacci retracement level at 1.1409 on Wednesday, reversed in favor of the euro, and began a new advance toward the 76.4% Fibonacci level at 1.1514. A rebound from this level would favor the U.S. dollar and could trigger a moderate decline toward 1.1409. A firm consolidation above 1.1514 would increase the likelihood of further gains toward the next Fibonacci level at 1.1578 (61.8%).
The wave structure on the hourly chart remains bearish despite the prolonged attempt by buyers to regain control. The latest completed downward wave failed to break below the previous low, while the latest upward wave has not yet exceeded the previous high. Meanwhile, the geopolitical situation has deteriorated again as the United States and Iran resumed military operations and disruptions to shipping through the Strait of Hormuz. Confirmation that the bearish trend has ended would require a break above the 1.1473 high. However, over the past three weeks, buyers have continued to show little conviction.
Wednesday's fundamental backdrop once again provided several noteworthy developments. A day earlier, traders learned that U.S. inflation had slowed to 3.5% year-on-year, an outcome that was largely unexpected. On Wednesday, it was also reported that the Producer Price Index (PPI) eased more than the market had anticipated, slowing to 5.5% year-on-year. Together, these two inflation indicators support the view that the disinflationary process has begun, which could significantly reduce the Federal Open Market Committee's (FOMC) hawkish stance.
However, while disinflation has begun, it may prove short-lived. In June, oil prices fell back to pre-conflict levels, but the conflict in the Middle East resumed in July, driving oil prices higher once again. As of Thursday morning, oil prices had risen by approximately 15–20% from their June lows. As a result, July's inflation reports may prove considerably less encouraging, reinforcing market expectations of further monetary tightening by the FOMC. Nevertheless, it remains extremely difficult to predict how events in the Middle East will unfold.
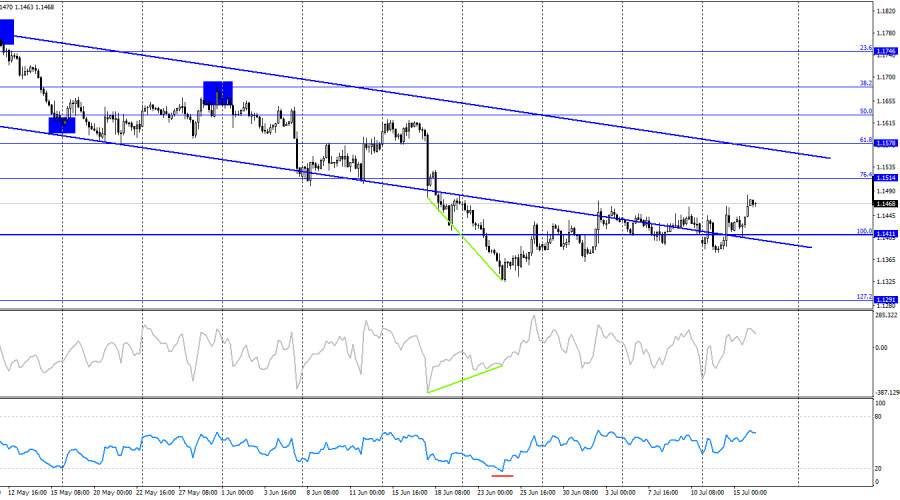
On the 4-hour chart, the pair continues to trade within a sideways range. A firm consolidation above 1.1411 suggests the potential for further gains. However, price direction has changed frequently in recent sessions, while overall trading activity remains subdued. No developing divergences are currently observed on any of the indicators. The descending trend channel remains intact.
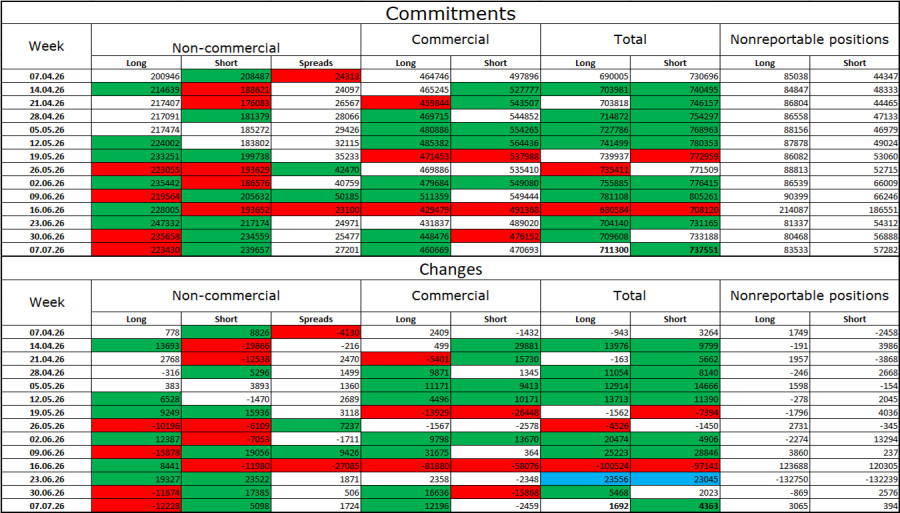
During the latest reporting week, professional traders closed 12,228 Long positions and opened 5,098 Short positions. Over the seven-week period spanning February and March, the bulls' overwhelming advantage disappeared due to the conflict involving Iran. Over the past fifteen weeks, however, market positioning has become more balanced following the suspension of hostilities in the Middle East. Speculative traders currently hold approximately 223,000 Long positions and 239,000 Short positions.
Overall, large institutional traders continue to maintain a constructive long-term view of the euro. Naturally, the numerous geopolitical and macroeconomic developments seen in recent years continue to influence investor sentiment. At present, market participants remain focused on the situation in the Middle East, where military operations have been suspended and negotiations have begun, potentially paving the way for a lasting peace agreement. At the same time, the market continues to overlook the improvement in geopolitical conditions, along with several other factors that remain supportive of the euro.
United States
The economic calendar for July 16 contains only two scheduled releases, neither of which is expected to have a significant impact. Therefore, macroeconomic data are likely to exert only limited influence on market sentiment on Thursday, mainly during the second half of the day.
Long positions became valid after a firm consolidation above 1.1409 on the hourly chart, with a target at 1.1514. Short positions may be considered following a firm consolidation below 1.1409 on the hourly chart, targeting 1.1290. However, current market movements remain extremely weak, and the 1.1409 level is not providing reliable trading signals.
Fibonacci retracement levels are plotted from 1.1409 to 1.1850 on the hourly chart and from 1.1411 to 1.1850 on the 4-hour chart.

QUICK LINKS
ForexMart is authorized and regulated in various jurisdictions.
(Reg No.23071, IBC 2015) with a registered office at First Floor, SVG Teachers Co-operative Credit Union Limited Uptown Building, Corner of James and Middle Street, Kingstown, Saint Vincent and the Grenadines
Restricted Regions: the United States of America, North Korea, Sudan, Syria and some other regions.








 Contact Us