The EUR/USD currency pair did not show any interesting movements on Friday, and volatility during the holidays has dropped nearly to zero. However, we can forget about last week and shift our attention to the upcoming week, which also has a "holiday" status. One can immediately assume that the New Year week will likely follow a similar pattern to Christmas week. In the first 2-3 weeks, some market movements may occur, but Thursday is a holiday, and it is unlikely that anyone will want to trade on Friday right before and after the holidays. The economic calendar for both the Eurozone and the U.S. is empty.
Thus, throughout the week, trading (or not trading) will largely depend on technical factors. The only reports in the Eurozone will be published on Friday—the business activity indices for the services and manufacturing sectors for December. These data could have influenced market sentiment if they were at least the first estimates. However, they will be second estimates and therefore attract little interest. There are no other significant events planned.
As a result, volatility this week is likely to be weak. Even if the "thin market" concept works, predicting movements can only be done based on technical factors. It is important to remember that a key point for the EUR/USD pair remains the flat on the daily timeframe, and in our opinion, the likelihood of its ending during the New Year week is extremely low. However, anything is possible in the currency market. We previously stated that the market is driven by market makers, whose goal is to provide liquidity to other traders. Therefore, to succeed, market makers need to outmaneuver other market participants. If it is necessary to move the pair up or down during the New Year, that is entirely possible.
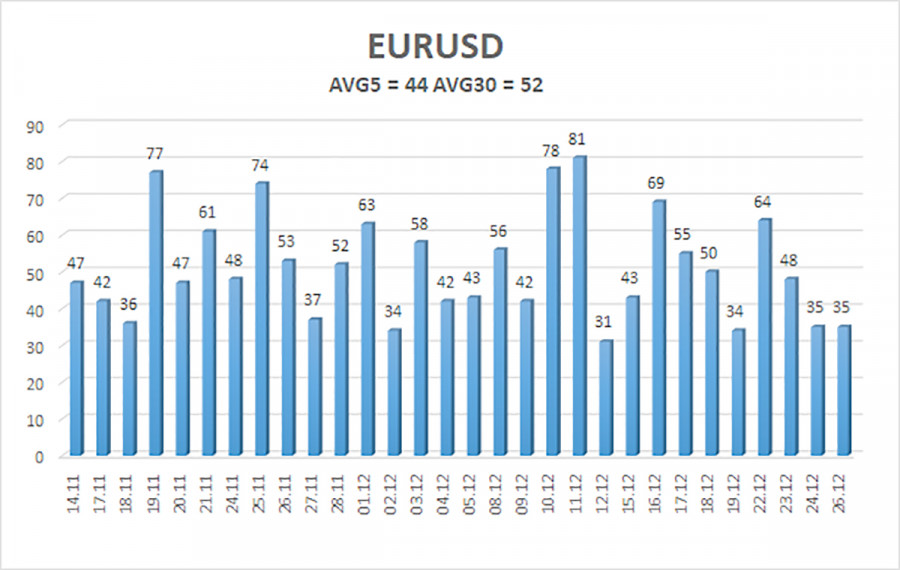
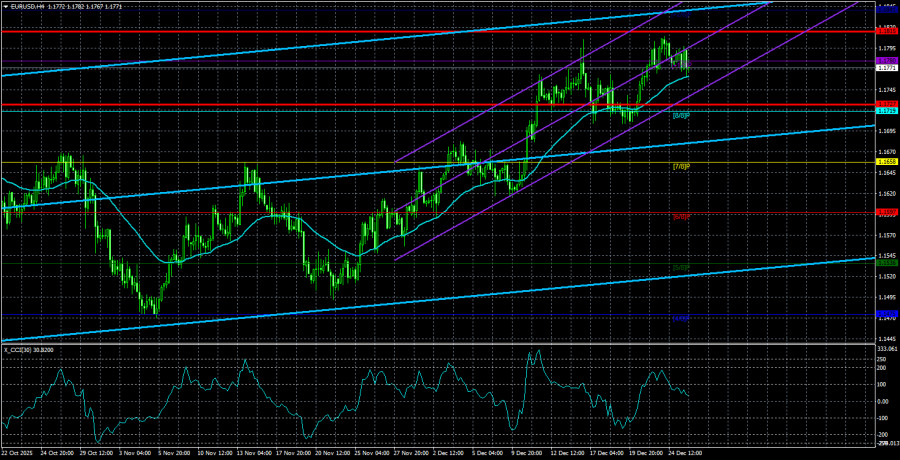
The average volatility of the EUR/USD pair over the last five trading days, as of December 29, is 44 pips and is classified as "low." We expect the pair to trade between 1.1727 and 1.1815 on Monday. The upper channel of the linear regression is turning upwards, but the flat continues on the daily timeframe. The CCI indicator entered oversold territory twice in October but moved to overbought territory at the beginning of December. We have already seen a small retracement.
The EUR/USD pair is positioned above the moving average line, and the upward trend remains intact across all higher timeframes, while the flat continues for the sixth month on the daily timeframe. The global fundamental backdrop remains significantly negative for the dollar. Over the past six months, the dollar has shown weak growth at times, but exclusively within the sideways channel. It lacks a fundamental basis for long-term strengthening. If the price is below the moving average, small shorts can be considered, targeting 1.1727 on purely technical grounds. Long positions remain relevant above the moving average line, targeting 1.1829 and 1.1830 (the upper boundary of the flat on the daily timeframe), which have already been effectively targeted. Now we need the flat to conclude.

QUICK LINKS
ForexMart is authorized and regulated in various jurisdictions.
(Reg No.23071, IBC 2015) with a registered office at First Floor, SVG Teachers Co-operative Credit Union Limited Uptown Building, Corner of James and Middle Street, Kingstown, Saint Vincent and the Grenadines
Restricted Regions: the United States of America, North Korea, Sudan, Syria and some other regions.


 Contact Us