Společnost Logista (BME:LOG) zveřejnila v pondělí výsledky za třetí čtvrtletí roku 2025, které byly převážně v souladu s odhady agentury Bloomberg.
Společnost vykázala za čtvrtletí ekonomický obrat ve výši 445 milionů EUR, což představuje meziroční pokles o 1 %. Tento údaj byl o 1 % nižší než prognóza společnosti Bernstein a o 2 % nižší než konsensus založený na pěti odhadech.
Upravený EBIT dosáhl ve 3. čtvrtletí 2025 výše 85 milionů EUR, což představuje pokles o 12 % ve srovnání se stejným obdobím loňského roku. Tento výsledek byl o 2 % vyšší než prognóza společnosti Bernstein, ale o 2 % nižší než konsensus založený na dvou odhadech.
Vykázaný EBIT činil 71 milionů EUR, což představuje meziroční pokles o 13 %, ale byl o 7 % vyšší než prognóza společnosti Bernstein.
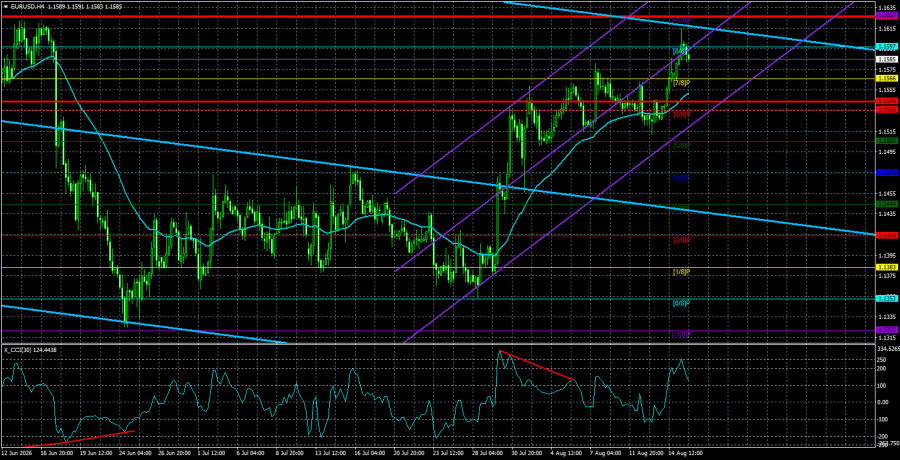
The EUR/USD currency pair continued to trade higher on Monday, despite no macroeconomic reports or fundamental events scheduled for the day. Thus, traders resumed buying the EUR/USD pair from the morning. On the 4-hour timeframe, the upward movement looks impressive, but on the daily chart, it is clear that if we are talking about a new wave of a global upward trend, we are only at the very beginning. Therefore, we expect the strengthening of the European currency to continue in the medium term.
Many analysts and traders are currently asking why the U.S. dollar is falling. We addressed this question throughout 2026. Although the dollar has been in demand for most of the current year, even novice traders understand the reasons behind it. At the beginning of the year, Donald Trump found no better way to divert attention from the "Epstein files" than to start a war with Iran. It suddenly became clear that Iran could launch a nuclear strike against the U.S. at any moment, so the nuclear threat needed to be urgently eliminated. This is what Trump focused on at the end of February this year. As of August 2026, America has failed to achieve any of its objectives in the Middle East, and Trump's military aggression has resulted only in the blockade of the Strait of Hormuz.
The U.S. dollar, which began the year with another decline and renewed four-year lows, suddenly started to rise sharply. Of course, it was impossible to predict that Trump would start a full-scale war, considering he had positioned himself as the leading peacemaker of the 21st century last year. Thus, the dollar's growth was unexpected. Nevertheless, investors began to save their capital and withdraw assets from the Middle East. This is why the dollar showed the growth that should not have occurred.
By mid-summer, the market was still buying the U.S. dollar, but for different reasons. Trump's war triggered a global oil crisis, leading to rising prices. Inflation increased, placing the task of controlling it before the Federal Reserve. The only way to control it is to raise the key rate and slow down the economy. However, the economy was slowing down in the second quarter even without the Fed's assistance, and the labor market has been declining for four consecutive months. Thus, the market completely overlooked two things. First, the Fed is now headed by Kevin Warsh, who Trump appointed to influence monetary policy. Second, high inflation does not automatically mean that the Fed will rush to tighten policy. The economy is slowing down, and the labor market is experiencing a painful crunch, so any tightening is out of the question at this time. If the labor market does not begin to recover, there will be no tightening. But how can the labor market start to recover if lowering the key rate is required to do so? The situation is a stalemate, and the Fed is unlikely to tighten given these conditions. The market had been actively anticipating tightening in 2026, but it is unlikely to see it.
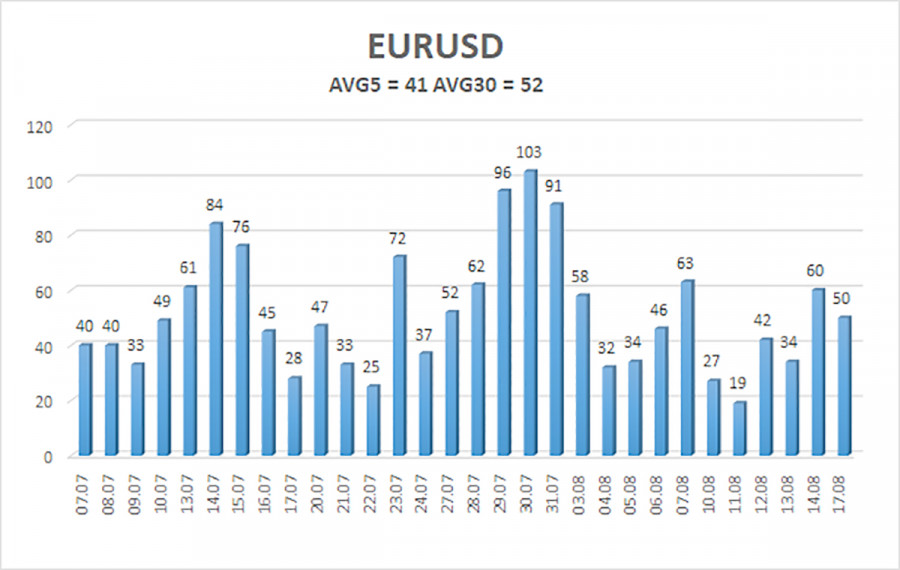
The average volatility of the EUR/USD currency pair over the past five trading days, as of August 18, is 41 pips, which is characterized as "low." We expect the pair to move between 1.1544 and 1.1626 on Tuesday. The higher linear regression channel is pointing down, indicating the preservation of the downward trend. The CCI indicator has entered overbought territory again, signaling a possible downward pullback.
The EUR/USD pair continues its upward trend on the 4-hour timeframe, suggesting the beginning of a new phase of the global uptrend on higher timeframes. The global fundamental backdrop for the dollar remains negative. However, in 2026, both geopolitical factors and the Fed's hawkish stance have provided significant support for the U.S. currency. At this time, these factors no longer support the dollar.
With the price positioned below the moving average, short positions can be considered, targeting 1.1505 and 1.1475. Long positions remain relevant above the moving average line with targets of 1.1597 and 1.1627.
QUICK LINKS
ForexMart is authorized and regulated in various jurisdictions.
(Reg No.23071, IBC 2015) with a registered office at First Floor, SVG Teachers Co-operative Credit Union Limited Uptown Building, Corner of James and Middle Street, Kingstown, Saint Vincent and the Grenadines
Restricted Regions: the United States of America, North Korea, Sudan, Syria and some other regions.








 Contact Us