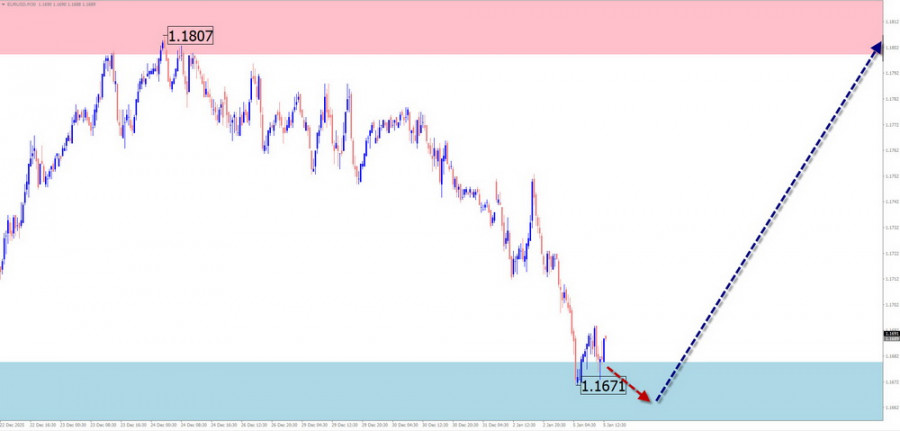
EUR/USD
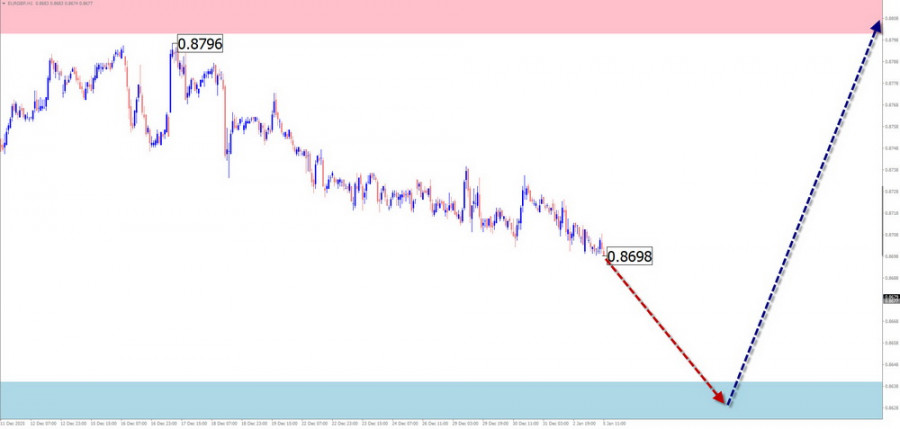
Analysis:On the EUR/USD chart, the euro has been developing a descending wave in a horizontal plane since July last year. In the larger wave structure, this section forms a corrective plane. The price has reached the upper boundary of a strong potential reversal zone on the weekly timeframe. There are no immediate reversal signals on the chart.
Forecast:In the coming days, the euro is expected to move along the calculated support. After probable pressure on the lower boundary of the zone, a reversal and the start of price growth can be expected. The maximum expected weekly upward move is limited by the calculated resistance zone.
Potential Reversal Zones:
Recommendations:
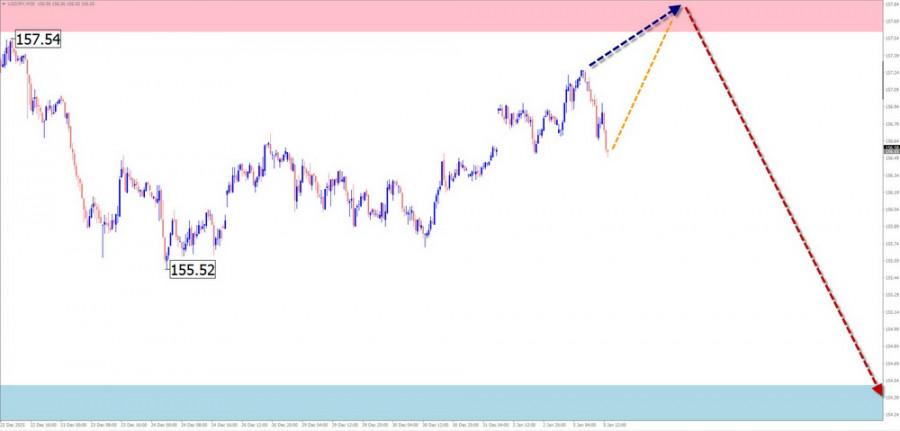
USD/JPY
Analysis:The trend of theUSD/JPY pair since April last year has been weakening the Japanese yen against the U.S. dollar. The upward vector in mid-November brought prices to the area of intermediate resistance. Since then, the last part of the wave has been developing as a correction.
Forecast:During the coming week, overall sideways price movement is expected. Short-term attempts to test the resistance zone may occur early in the week. A brief breach of the upper boundary cannot be excluded. Later, a reversal and decline toward the calculated support area can be expected.
Potential Reversal Zones:
Recommendations:
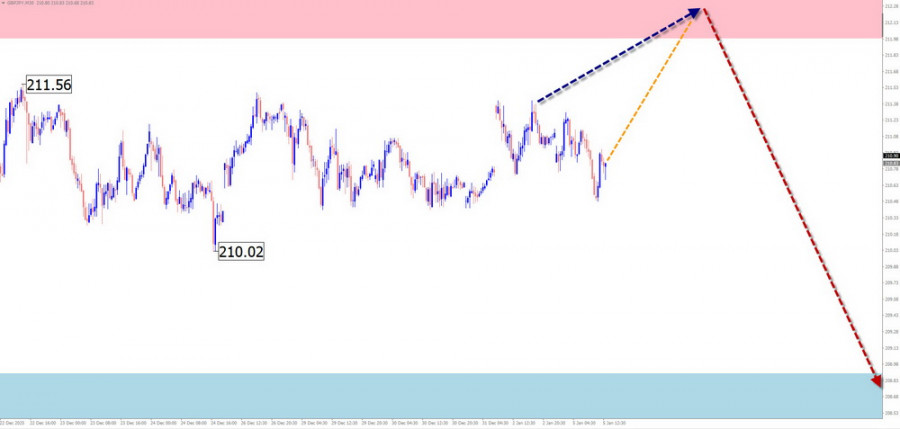
GBP/JPY
Analysis:On the GBP/JPY chart, the pound has been developing an upward zigzag wave since April last year. The final part (C) of the wave has reached the lower boundary of a potential reversal zone. Over the last two weeks, the price has moved sideways, forming a corrective plane.
Forecast:In the coming days, the sideways movement is expected to continue, with prices moving along the calculated resistance boundaries. In the second half of the week, a reversal and the start of downward movement are likely, with the price staying above the potential reversal zone.
Potential Reversal Zones:
Recommendations:
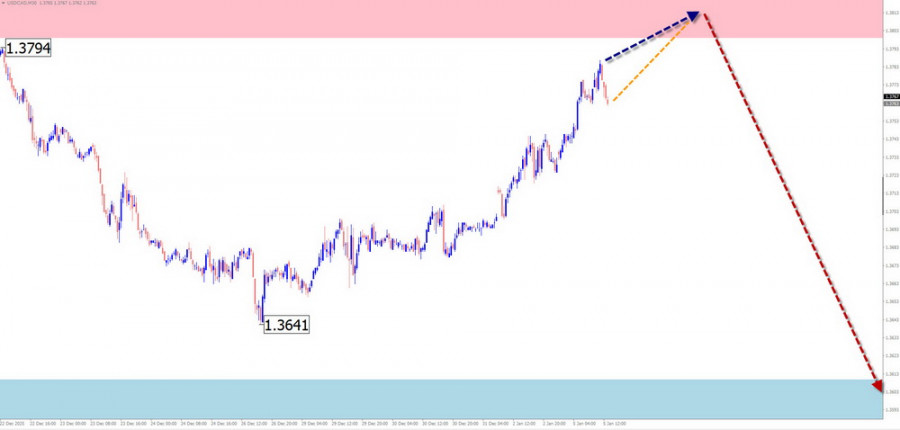
USD/CAD
Analysis:On the USD/CAD chart, the growth trend of the Canadian dollar over the last year has been replaced by a corrective move. Within the bear wave that began on February 3 last year, the final part (C) has been developing over the past two months. At the time of analysis, the first part (A) is approaching completion.
Forecast:During the coming week, overall sideways movement is expected. Early in the week, an upward vector may occur, targeting the calculated resistance zone. Afterwards, a reversal and decline in the Canadian dollar are expected, potentially testing the lower support boundary.
Potential Reversal Zones:
Recommendations:
EUR/GBP
Analysis:The EUR/GBP pair has been forming a descending wave since April last year. The wave is developing according to a stretched/shifted plane algorithm. The middle part (B) of the wave is nearing completion. The price has reached the lower boundary of a strong potential reversal zone, but no immediate reversal signals are observed.
Forecast:At the start of the week, the downward vector is likely to continue along the lower boundary of the resistance zone. Reversal formation and a downward move can be expected in the second half of the week.
Potential Reversal Zones:
Recommendations:
Gold
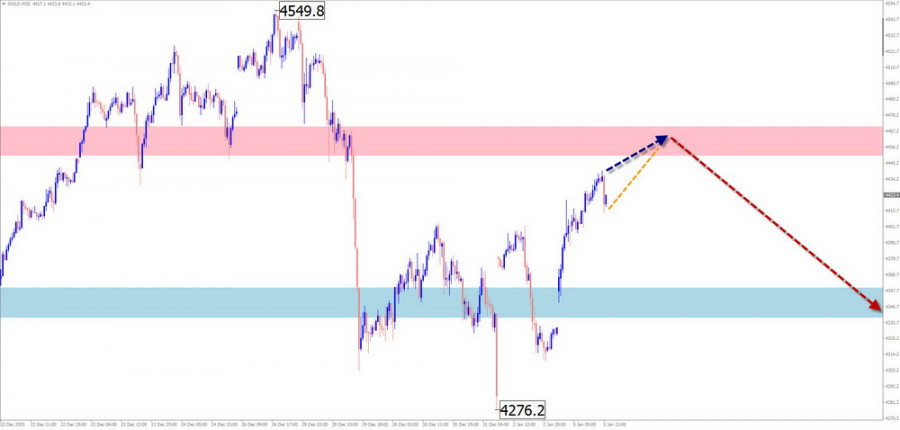
Analysis:Short-term trends in gold over recent years have been guided by an upward wave algorithm. The final part (C) of the currently incomplete corrective wave is nearing completion. The upward wave from December 29 has reversal potential.
Forecast:Next week, the sideways trend is expected to end, followed by the start of a downward move. Early in the week, a brief rise toward the resistance zone is possible, after which a reversal and price decline are expected. A change in direction may lead to higher volatility and a brief breach of the upper boundary of the control zone.
Potential Reversal Zones:
Recommendations:
Notes: In simplified wave analysis (SWA), all waves consist of 3 parts (A-B-C). The last incomplete wave is analyzed on each timeframe. Expected movements are shown with dotted lines.
Attention: The wave algorithm does not account for the duration of price movements over time.
QUICK LINKS
ForexMart is authorized and regulated in various jurisdictions.
(Reg No.23071, IBC 2015) with a registered office at First Floor, SVG Teachers Co-operative Credit Union Limited Uptown Building, Corner of James and Middle Street, Kingstown, Saint Vincent and the Grenadines
Restricted Regions: the United States of America, North Korea, Sudan, Syria and some other regions.


 Contact Us