The EUR/USD currency pair continued to move "as if at a funeral." Over the past seven trading days, the European currency has fallen from 1.1911 to 1.1820. In other words, dropping almost every day, it covered approximately 90 pips. This translates to about 13 pips of movement per day. The average volatility is around 40 pips, which perfectly aligns with the current state of the currency market. Once again, we must state that movements are virtually absent. Essentially, if traders had opened short positions a week ago, they could have earned about 40 pips over the past week and a half. What more can be added?
The market does not know what to do next or how to interpret all the information it has received. The question of a US attack on Iran hangs in the air. On one hand, Trump has sent a second armada of warships to Iran's shores. On the other hand, the second round of negotiations between Tehran and Washington took place at the Geneva conference, and experts have even expressed hope for a peaceful resolution to the conflict.
Moreover, traders cannot interpret the US labor market data released in January. On the one hand, there is progress: unemployment has decreased for the second consecutive month, and the number of Nonfarm Payrolls has finally exceeded 100,000 for the first time in a long while. On the other hand, 130,000 is still a modest figure; the annual value for 2025 has been revised to a "ridiculous" level, and confidence in the January job-creation statistics is slightly above zero, given that the Bureau of Labor Statistics revises its reports downward nearly every month.
The situation is no better with American inflation. On one hand, it is slowing down and currently stands at 2.4%. On the other hand, we do not see any strengthening of "dovish" sentiments within the Fed. Remember that inflation in the UK is at 3% (according to January's report), and that such a figure almost guarantees a reduction in the Bank of England's key interest rate at the next meeting. The current BA rate is 3.75%, GDP growth is 1% year-on-year... At the same time, the Fed is considering the feasibility of a new easing of monetary policy, with inflation at 2.4%, a current key rate of 3.75%, and an annual GDP growth rate of 2.3%... Where is the logic?
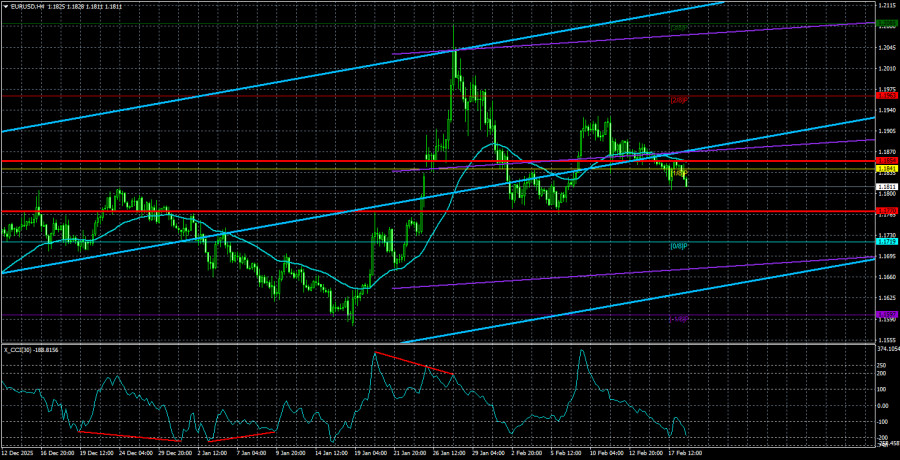
Given the multitude of contradictions in the market right now, we once again observe a complete unwillingness of traders to trade in either direction. Perhaps this calm is the quiet before the next storm. Overall, the current downward correction was anticipated after the CCI indicator entered the overbought area. On the daily timeframe, the price remains above the Kijun-sen line of the Ichimoku indicator, indicating an upward trend. Therefore, unfortunately, not without another pause, we still expect a serious strengthening of the euro in 2026.
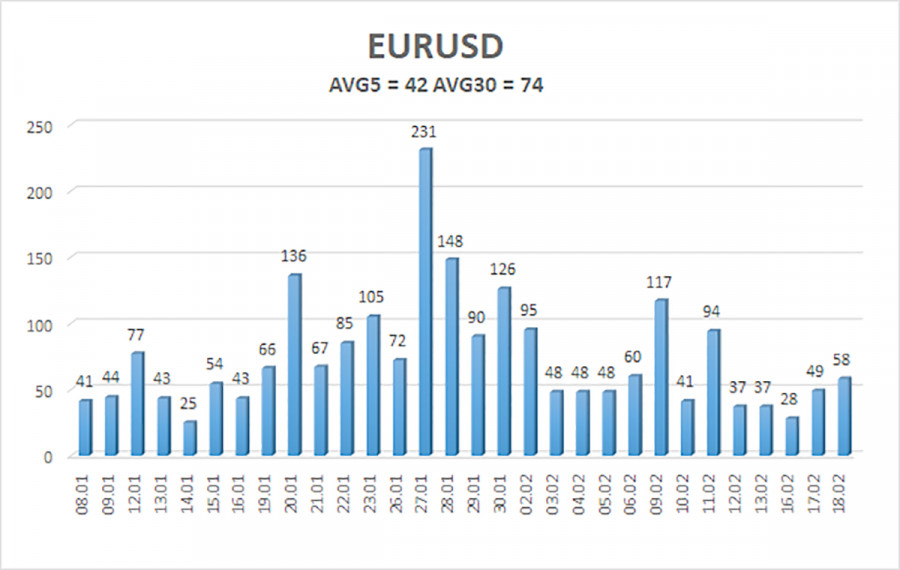
The average volatility of the EUR/USD currency pair for the last 5 trading days as of February 19 is 42 pips, and is characterized as "low." We expect the pair to move between 1.1770 and 1.1854 on Thursday. The upper channel of the linear regression points upward, indicating further growth for the euro. The CCI indicator has entered the overbought area, which warns of a downward correction.
S1 – 1.1719
S2 – 1.1597
S3 – 1.1475
R1 – 1.1841
R2 – 1.1963
R3 – 1.2085
The EUR/USD pair continues its correction within an upward trend. The global fundamental backdrop remains extremely negative for the dollar. The pair spent seven months in a sideways channel, and it is likely that now is the time to resume the global trend of 2025. For long-term growth, the dollar lacks a fundamental basis. Therefore, all that the dollar can hope for is range trading or corrections.
With the price below the moving average, small short positions can be considered, with targets at 1.1770 and 1.1719 on purely technical grounds. Above the moving average line, long positions remain relevant with targets of 1.1963 and 1.2085.
Regression channels help determine the current trend. If both are oriented in the same direction, it indicates a strong trend;
The moving average line (settings 20,0, smoothed) defines the short-term trend and the direction in which trading should currently be conducted;
Murray levels are target levels for movements and corrections;
Volatility levels (red lines) are the probable price channel in which the pair will operate in the next 24 hours, based on current volatility indicators;
The CCI indicator—its entry into the oversold area (below -250) or the overbought area (above +250) indicates that a trend reversal in the opposite direction is approaching.

LINKS RÁPIDOS
ForexMart is authorized and regulated in various jurisdictions.
(Reg No.23071, IBC 2015) with a registered office at First Floor, SVG Teachers Co-operative Credit Union Limited Uptown Building, Corner of James and Middle Street, Kingstown, Saint Vincent and the Grenadines
Restricted Regions: the United States of America, North Korea, Sudan, Syria and some other regions.


 Contate-nos