Asijské akciové trhy ve čtvrtek mírně posílily, zatímco americký dolar oslaboval v očekávání rozhodnutí Evropské centrální banky (ECB). Investoři pozorně sledují vývoj měnové politiky v době, kdy světová ekonomika čelí zvýšené nejistotě a geopolitickým tlakům. Nejisté vyhlídky globálního růstu, spojené s nepředvídatelnými obchodními zásahy ze strany USA, nutí investory přehodnocovat své pozice. V centru pozornosti tak zůstává ECB, jejíž signály mohou výrazně ovlivnit směr světových trhů v nadcházejících týdnech.
Dolar oslabil poté, co byly ve Spojených státech zveřejněny slabší údaje o trhu práce a sektoru služeb. Tento vývoj podnítil obavy o zpomalení americké ekonomiky. V pátek mají být zveřejněny další data o zaměstnanosti, která mohou potvrdit trend oslabujícího trhu práce. Dolar navíc čelí tlaku kvůli pokračující nejistotě kolem obchodní politiky prezidenta Donalda Trumpa, jehož poslední kroky zahrnují zdvojnásobení cel na dovoz oceli a hliníku. Tato opatření mají přímý dopad na hlavní obchodní partnery USA, včetně Kanady a Mexika.
Kanada se už připravuje na případná odvetná opatření a Evropská unie hlásí určitý pokrok v jednáních s Washingtonem. Zatímco politická rétorika zůstává tvrdá, skutečný průlom v podobě nových dohod zatím nenastal. Tato nejistota se promítá i do očekávání ohledně rozhodnutí ECB. Trh již téměř s jistotou předpokládá, že ECB přistoupí ke snížení úrokových sazeb, otázkou však zůstává, jaký tón zvolí prezidentka Christine Lagardeová ohledně budoucího vývoje.
Podle senior analytika Kylea Roddy ze společnosti Capital.com bude zásadní právě rétorika ECB. Pokud nebude dostatečně „holubičí“, může to negativně ovlivnit akciové trhy a naopak posílit euro. Lagardeová tak bude čelit náročnému úkolu – na jedné straně uklidnit trhy a na druhé straně si ponechat prostor pro flexibilní reakce na další vývoj globální ekonomiky. Jak dodává Rodda, investoři očekávají náznaky, zda ECB zůstane v módu uvolněné měnové politiky i ve druhé polovině roku.
V Asii mezitím akcie vesměs rostly. Nejširší index MSCI v Asii a Tichomoří mimo Japonsko vzrostl o 0,4 %, zatímco japonský index Nikkei o 0,5 % oslabil. Jihokorejský index KOSPI si připsal 0,9 % a dosáhl 11měsíčního maxima, a to především díky pozitivnímu výhledu po vítězství prezidenta Lee Jae-myunga. Optimismus se šířil i v Hongkongu, kde index Hang Seng stoupl o 0,5 %, a to zejména díky technologickým titulům.
Australský stratég Chris Nicol ze společnosti Morgan Stanley upozorňuje na určitou míru sebeuspokojení na trzích. Podle něj investoři příliš spoléhají na to, že se brzy dosáhne konkrétních dohod, ale v realitě zatím neexistuje jasná politika, která by naznačovala směr růstu a vývoje inflace. Tento postoj se může snadno změnit, pokud dojde k novým otřesům – ať už v obchodních vztazích, nebo na poli měnové politiky.
Na devizových trzích se dolarový index, který sleduje výkon amerického dolaru vůči koši měn, mírně zotavil o 0,1 % na 98,879 bodu po předchozím poklesu o 0,5 %. Dolar posílil vůči jenu o 0,2 % na 143 jenů, zatímco euro zůstalo téměř beze změny na 1,1411 USD, což navazuje na 0,4% zisk z předchozí seance. Trhy tak zůstávají v režimu vyčkávání a jsou citlivé na jakýkoli náznak budoucího směřování měnové politiky v Evropě i ve Spojených státech.
Na komoditních trzích zaznamenalo zlato mírný pokles – jeho spotová cena klesla o 0,2 % na 3 367,30 USD za unci. Investoři zjevně částečně vybírají zisky z předchozího růstu a vyčkávají na výsledek zasedání ECB. Cena ropy se rovněž snížila – americká lehká ropa WTI ztratila 0,5 % a obchodovala se za 62,58 USD za barel. Tento pokles byl způsoben nejen vyššími zásobami ropy v USA, ale také rozhodnutím Saúdské Arábie snížit ceny pro asijské odběratele v červenci.
Futures kontrakty na pan-evropský index Euro Stoxx 50 i americký index S&P 500 e-minis zůstaly v průběhu čtvrtečního rána téměř beze změny. Trhy tedy očekávají další vývoj, přičemž hlavní pozornost se nyní soustředí na Frankfurt. Jakýkoli signál ECB, který překvapí svým tónem nebo naznačí změnu ve výhledu, může ovlivnit nejen evropské, ale i světové finanční trhy.
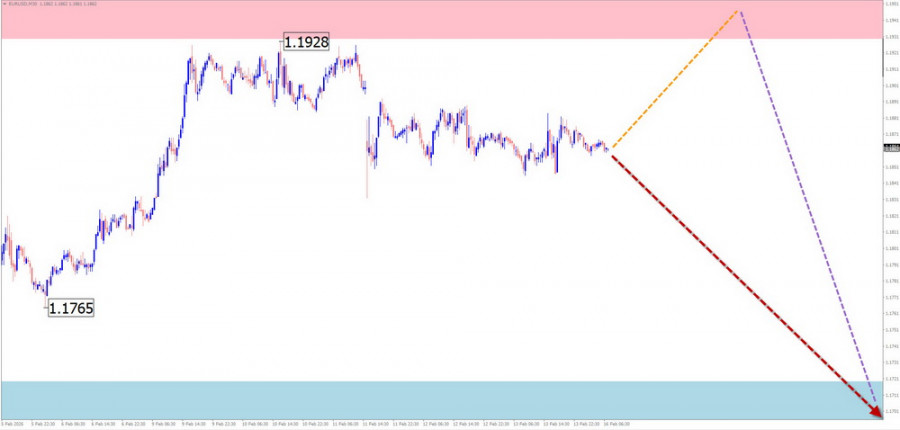
EUR/USD
Analysis:
On the chart of the euro, a downward wave that began in April of last year is still unfolding. It has the form of a descending flat. Since January 27, the beginning of wave segment (C) has been forming, with reversal potential. At present, the price is located near the lower boundary of a strong potential reversal zone.
Forecast:
At the beginning of the week, the euro is likely to maintain a sideways price movement. A pullback toward the resistance zone and short-term pressure on its upper boundary are possible. In the second half of the week, a change in direction and a resumption of price decline toward the calculated support level can be expected.
Potential Reversal Zones
Resistance:
Support:
Recommendations:
Buy: There will be no conditions for entering such trades in the pair during the upcoming week.
Sell: If confirmed reversal signals appear in the resistance zone, such trades may be profitable. The downside potential is limited by support.
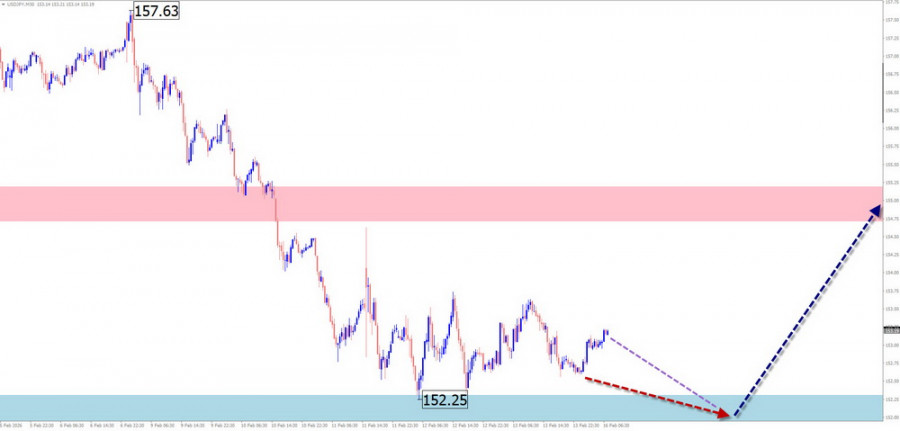
USD/JPY
Analysis:
On the chart of the main Japanese yen pair, the direction of price movement since last spring has been determined by an upward wave pattern. After the correction that ended on January 27, quotes are forming a reversal wave zigzag. The calculated support runs along the upper boundary of a strong large-timeframe potential reversal zone.
Forecast:
In the next couple of days, sideways movement and a mild downward bias are expected. Near the calculated support, quotes are likely to drift and form a reversal. By the weekend, the price will most likely resume its upward movement, with potential toward the resistance boundaries.
Potential Reversal Zones
Resistance:
Support:
Recommendations:
Sell: Such trades will be high-risk during the upcoming week.
Buy: Can be used in trading if appropriate reversal signals from your trading system appear in the reversal zone.
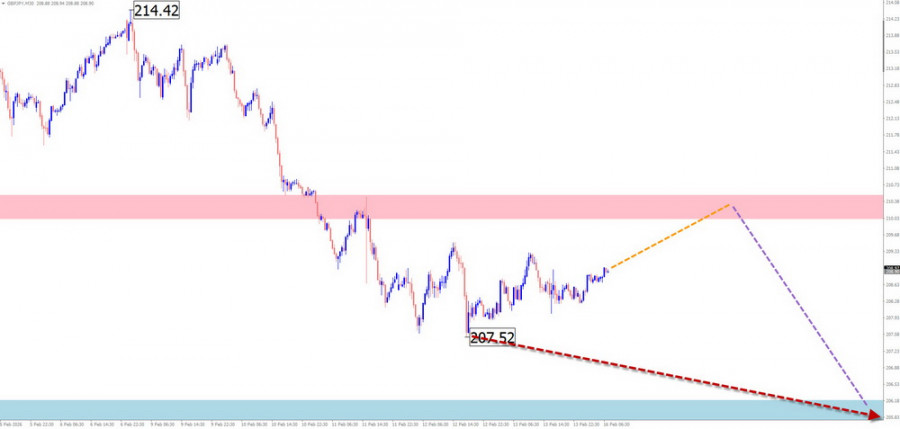
GBP/JPY
Analysis:
The currently unfinished wave structure of the pound/yen pair is directed upward. It has been developing since April of last year. Over the past three months, a complex correction that remains incomplete has been forming within this wave structure. Quotes are approaching an intermediate support zone on a large timeframe.
Forecast:
Over the coming week, price movement between the nearest opposing zones is expected. After a likely pullback toward the resistance zone in the first few days, a change in direction can be anticipated. A decline toward the support boundaries is more probable in the second half of the week.
Potential Reversal Zones
Resistance:
Support:
Recommendations:
Sell: Possible with reduced position size within individual sessions toward the calculated support boundaries.
Buy: Such trades may become relevant after appropriate reversal signals appear near the support zone.
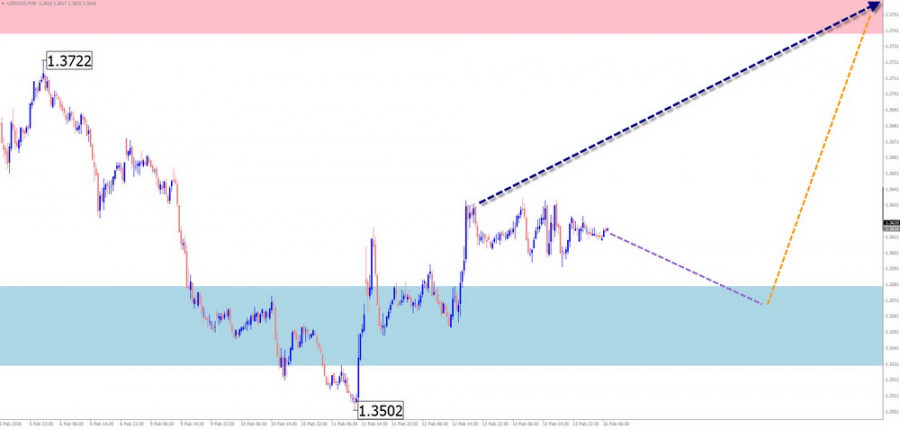
USD/CAD
Analysis:
The bearish trend wave on the Canadian dollar chart had been setting the direction of the short-term trend until recently. Since January 30, an upward movement with strong reversal potential has been forming in the opposite direction. In recent weeks, a correction has been developing within this wave structure. At the time of analysis, quotes are located at a cluster of levels from different timeframes.
Forecast:
During the upcoming week, overall sideways movement is expected to continue. At the beginning of the week, pressure on support is possible, including a brief break below its lower boundary. This may be followed by a reversal and price growth toward the resistance zone. A change in direction is likely toward the end of the current or the following week.
Potential Reversal Zones
Resistance:
Support:
Recommendations:
Sell: Lacks potential and carries a high degree of risk.
Buy: Can be used in trading after confirmed reversal signals appear near the support zone.
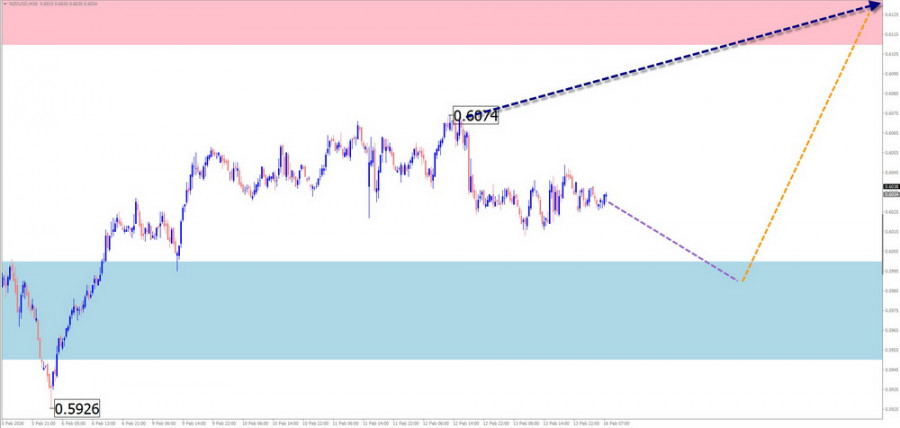
NZD/USD
Analysis:
On the New Zealand dollar chart, the trend direction since November of last year has been set by an upward wave. Over the past three weeks, a corrective segment (B) has been forming within its structure. Since February 5, an upward segment with reversal potential has been developing on the chart, which remains unfinished.
Forecast:
At the beginning of the upcoming week, the current downward movement is expected to complete near the calculated support. A transition to sideways movement and the formation of a reversal are expected afterward. A resumption of growth can be anticipated closer to the weekend.
Potential Reversal Zones
Resistance:
Support:
Recommendations:
Sell: Can be used with reduced position size within individual sessions.
Buy: Premature until reversal signals appear near the support zone.
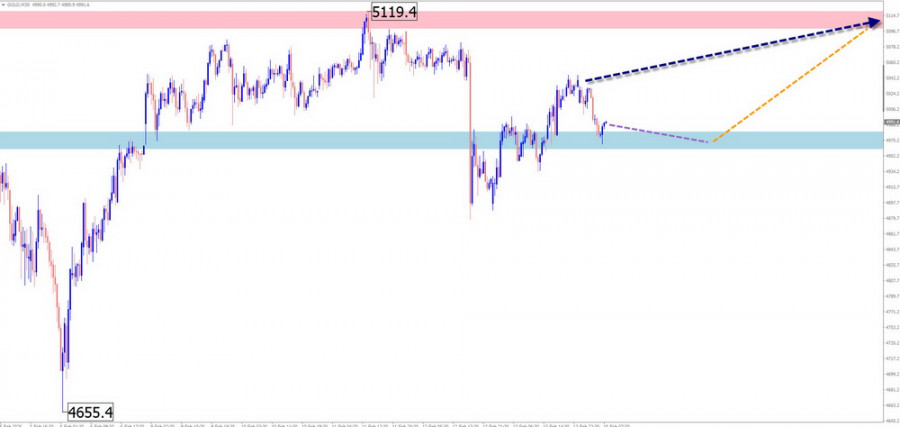
Gold
Analysis:
A bullish trend continues on the gold chart. The structure of the latest unfinished downward wave segment, starting from January 29 of last year, does not yet show completion. At the time of analysis, this movement remains within the correction of the latest trend segment. Gold quotes are drifting between potential reversal zones of different scales.
Forecast:
Over the next few days, a price decline toward the support zone can be expected. After that, a reversal may form. A resumption of price growth is likely in the second half of the week.
Potential Reversal Zones
Resistance:
Support:
Recommendations:
Sell: Such trades are risky and may lead to losses.
Buy: Suitable conditions for such trades will arise after appropriate reversal signals appear near the calculated support zone in your trading system.
Notes: In simplified wave analysis (SWA), all waves consist of three parts (A–B–C). On each timeframe, the last unfinished wave is analyzed. Dashed lines indicate expected movements.
Attention: The wave algorithm does not take into account the duration of price movements over time.
LINKS RÁPIDOS
ForexMart is authorized and regulated in various jurisdictions.
(Reg No.23071, IBC 2015) with a registered office at First Floor, SVG Teachers Co-operative Credit Union Limited Uptown Building, Corner of James and Middle Street, Kingstown, Saint Vincent and the Grenadines
Restricted Regions: the United States of America, North Korea, Sudan, Syria and some other regions.


 Contate-nos