Pokud zvažujete, kam investovat své dlouhodobé peníze, jedním z nejspolehlivějších a nejméně náročných způsobů je indexový fond sledující S&P 500, jako například Vanguard S&P 500 ETF (ticker: VOO). Tento fond nabízí mimořádně nízké náklady a širokou expozici vůči americkým akciím s velkou tržní kapitalizací. Investovat do něj lze snadno přes jakéhokoli důvěryhodného online brokera, protože se obchoduje stejně jako běžná akcie.
Index S&P 500 tvoří 500 největších veřejně obchodovaných společností v USA a pokrývá přibližně 80 % tržní hodnoty celého amerického akciového trhu. Fondy jako VOO se snaží kopírovat výkon tohoto indexu tak, že drží většinu nebo všechny tyto společnosti ve stejných poměrech.
Podle aktuálních dat patří mezi největší složky indexu firmy jako:
Další velké společnosti zahrnují například Alphabet (Google) [GOOG] [GOOGL], Tesla [TSLA], Broadcom [AVGO] a Berkshire Hathaway [BRK-A] [BRK-B]. Kromě toho je v indexu dalších 490 firem, včetně Netflixu [NFLX], Nike [NKE], General Motors [GM], Best Buy [BBY] či Campbell’s [CPB].
Z pohledu sektorů dominuje v portfoliu fondů sledujících S&P 500 technologie (přes 31 %), následují finanční služby, zdravotnictví a cyklické spotřební zboží.
Index S&P 500 v dlouhém horizontu historicky dosahuje průměrného ročního výnosu kolem 10 % (nepočítáno s inflací). Samozřejmě platí, že výnosy kolísají a žádné období není stejné, nicméně z dlouhodobého hlediska se ukazuje, že trh má tendenci růst.
Průměrné roční výnosy v posledních obdobích byly:
Pokud například budete pravidelně investovat 15 000 USD ročně a index bude v průměru růst o 8 % ročně, pak:
To ukazuje sílu pravidelného investování a složeného úročení, které je hlavním motorem dlouhodobého růstu kapitálu.

Velkou výhodou fondů jako Vanguard S&P 500 ETF je jejich ultranízký poplatek (expense ratio) – konkrétně jen 0,03 % ročně. To znamená, že za každých 10 000 USD investovaných zaplatíte pouze 3 dolary ročně. Díky tomu téměř veškerý výnos zůstává vám jako investorovi. Nízké náklady jsou jedním z hlavních důvodů, proč jsou pasivně spravované indexové fondy čím dál populárnější.
Navíc fondy jako VOO jsou extrémně likvidní – můžete je kdykoli koupit nebo prodat během obchodního dne. To je velká výhoda oproti tradičním podílovým fondům, které se obchodují pouze jednou denně po uzavření trhu.
Investování do S&P 500 ETF je vhodné pro každého dlouhodobého investora, který hledá jednoduchý, diverzifikovaný a nákladově efektivní způsob, jak zhodnocovat své úspory. Je to ideální nástroj pro budování penzijního portfolia, rezervy na vzdělání nebo jakéhokoli jiného cíle, který má horizont v řádu let nebo desetiletí.

I když samozřejmě neexistují žádné záruky výnosů, historická výkonnost S&P 500 a logika široké diverzifikace dávají tomuto přístupu vysokou pravděpodobnost úspěchu. Pokud budete pravidelně investovat a udržíte si disciplínu, může být tento ETF klíčem k dosažení finanční nezávislosti.
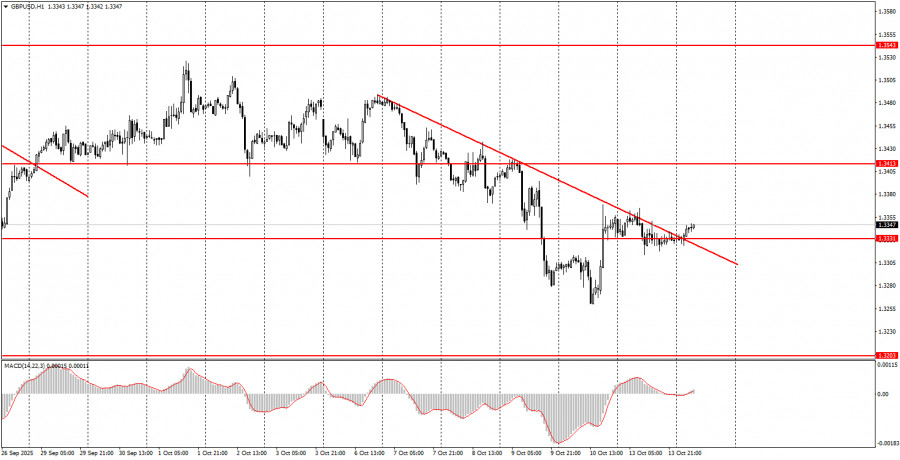
The GBP/USD pair showed absolutely no interesting movement on Monday. While the euro (for unknown reasons) declined during the first half of the day, the British pound remained stationary throughout the day. However, overnight into Tuesday, the GBP/USD pair managed to break through a descending trendline, indicating a logical and long-awaited end to the descending trend.
Let us recall that in the past two weeks, the British currency had very few reasons to fall, while the U.S. dollar had few reasons to rise. We do not deny the necessity of occasional corrections—and on the daily timeframe, we do acknowledge the presence of a flat market. Therefore, the recent decline of the British pound can only be explained by technical factors. From a fundamental and macroeconomic perspective, the fall of the GBP/USD pair is entirely illogical. On Monday, there were no significant events or reports either in the UK or the U.S.
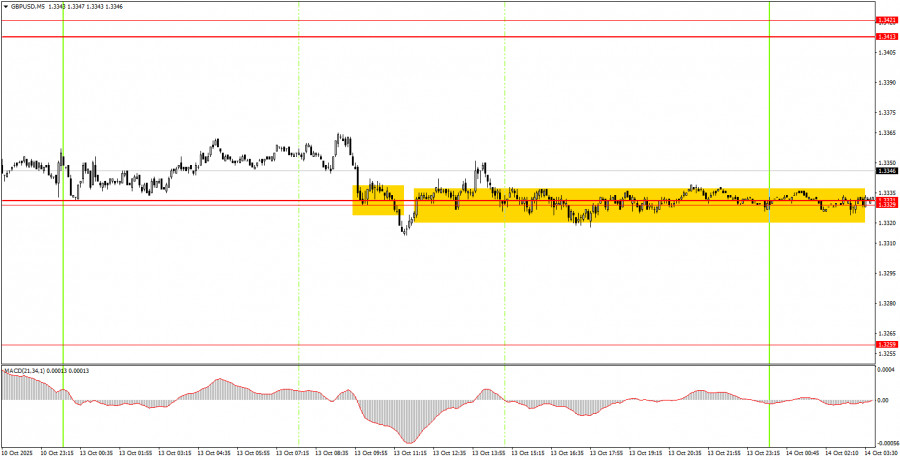
On the 5-minute timeframe, a sell signal was formed on Monday in the area of 1.3329–1.3331, but throughout the day, the price moved more sideways than up or down. The expected growth did not occur, but the anticipated flat did. Thus, novice traders may have attempted to open positions, but by the start of the U.S. session, it had become clear that no substantial movement would take place.
On the hourly time frame, the GBP/USD pair continues to emerge from a descending trend. As mentioned before, there is no reason to expect a prolonged U.S. dollar rally, so from a medium-term perspective, we anticipate movement only to the upside. However, the market remains in a very strange condition. The pound continues to drop, and there is no rational explanation for it—other than technical ones. Price action is often illogical.
On Tuesday, the GBP/USD pair may attempt to continue its upward movement since the trendline has been broken. A consolidation above the 1.3329–1.3331 area will also allow for the opening of long positions, even though the market ignored this zone throughout Monday.
On the 5-minute TF, you can now trade at levels 1.3102-1.3107, 1.3203-1.3211, 1.3259, 1.3329-1.3331, 1.3413-1.3421, 1.3466-1.3475, 1.3529-1.3543, 1.3574-1.3590, 1.3643-1.3652, 1.3682, 1.3763. For Tuesday, the UK is scheduled to release reports on unemployment, jobless claims, and wages. These reports are not the most critical under the current circumstances, but there aren't any others—due to the ongoing U.S. government shutdown, the U.S. Bureau of Statistics remains on forced hiatus. In the U.S., a speech by Federal Reserve Chair Jerome Powell is scheduled, which may be of some interest.
Important speeches and reports (always listed in the economic calendar) can strongly affect the movement of a currency pair. Therefore, during such events, it is recommended to trade with maximum caution or exit the market altogether to avoid sharp price reversals.
Beginner traders should remember that not every trade will be profitable. Developing a strict trading strategy and proper money management are key to long-term success in forex trading.

LINKS RÁPIDOS
ForexMart is authorized and regulated in various jurisdictions.
(Reg No.23071, IBC 2015) with a registered office at First Floor, SVG Teachers Co-operative Credit Union Limited Uptown Building, Corner of James and Middle Street, Kingstown, Saint Vincent and the Grenadines
Restricted Regions: the United States of America, North Korea, Sudan, Syria and some other regions.


 Contate-nos