S&P 500
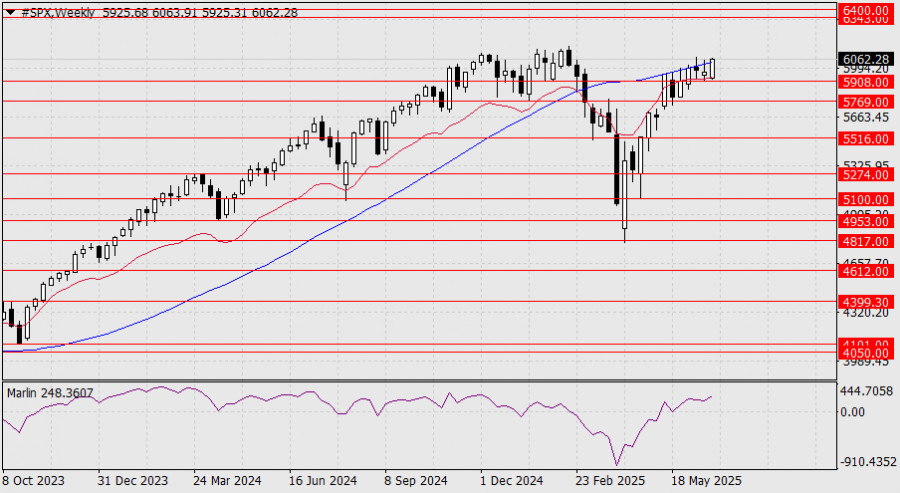
The new week began with confident growth for the S&P 500. The support from the balance line indicator (the red moving average) on the weekly timeframe worked well to initiate the upward movement.
After three weeks of horizontal movement, the Marlin oscillator's signal line is now choosing a bullish direction. This morning, the futures quote has risen above the MACD indicator line, showing its intention to target the 6343–6400 range.
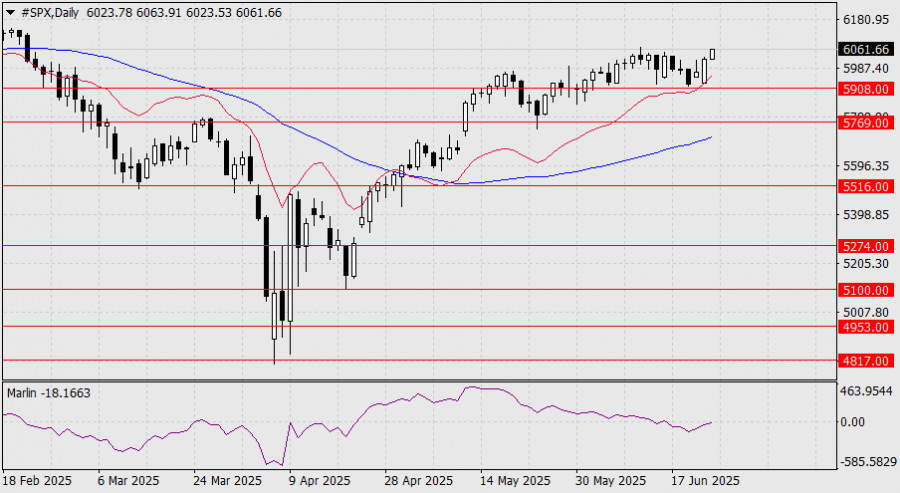
On the daily chart, the price has also bounced off the support of the balance line. The Marlin oscillator is returning to positive territory. After two weeks of sideways movement, the price resumes its upward trend.
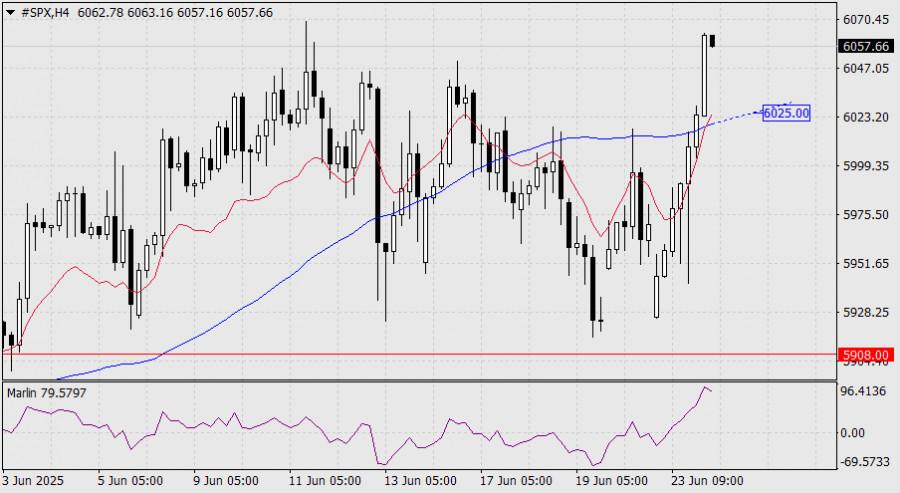
On the H4 chart, the price has already consolidated above the balance and MACD lines as of this morning. The Marlin oscillator is also heading upward, approaching the overbought zone.
Should the price decide to correct, the MACD line near the 6025 mark is expected to act as the key support level and limit the correction.

LINKS RÁPIDOS
ForexMart is authorized and regulated in various jurisdictions.
(Reg No.23071, IBC 2015) with a registered office at First Floor, SVG Teachers Co-operative Credit Union Limited Uptown Building, Corner of James and Middle Street, Kingstown, Saint Vincent and the Grenadines
Restricted Regions: the United States of America, North Korea, Sudan, Syria and some other regions.


 Contate-nos