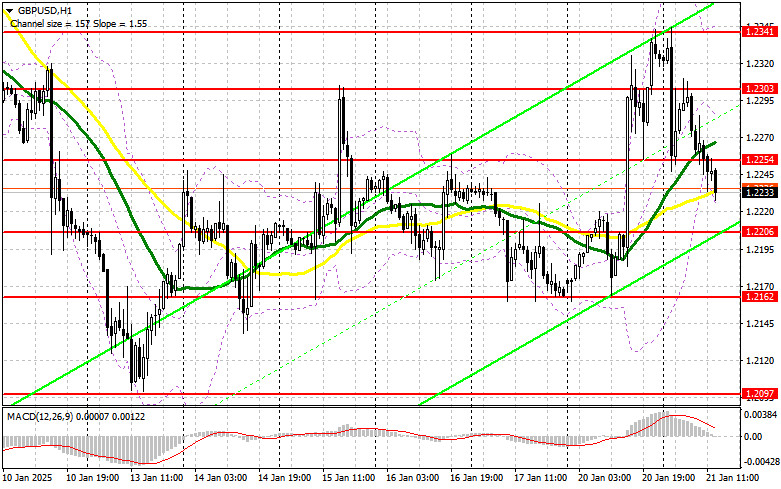

In my morning forecast, I focused on the level of 1.2249 and planned to make trading decisions from there. Let's analyze the 5-minute chart to see what happened. A decline and the formation of a false breakout near 1.2249 provided an entry point for buying the pound, but significant growth did not materialize. A breakout and retest of 1.2249 with an entry point for selling showed a 20-point decline, after which pressure on the pair eased. The technical outlook was revised for the second half of the day.
The news that the UK unemployment rate unexpectedly exceeded economists' forecasts reinforced market participants' belief that the Bank of England must urgently continue lowering interest rates to prevent the economy from quickly sliding into recession. Unfortunately, there is no U.S. data scheduled for release in the second half of the day, so all attention will focus on new statements from Donald Trump and his administration's decisions.
If the pair declines, I plan to buy only after a false breakout near the nearest support at 1.2206, similar to the scenario described earlier. The target will be a recovery to 1.2254, a resistance level formed during the first half of the day. A breakout and retest of this range from above will provide a new entry point for long positions, with the potential for a move toward 1.2303, reducing pressure on buyers. The ultimate target will be around 1.2341, where I plan to take profits.
If GBP/USD declines further and there is no bullish activity at 1.2206, which seems likely, the pound could fall further, erasing all gains observed before Trump's inauguration. In this case, only a false breakout around the 1.2162 low would provide suitable conditions for opening long positions. Direct long positions on a bounce are planned from 1.2097, targeting a 30–35-point intraday correction.
Sellers did substantial work in the first half of the day, taking control of the nearest support level and turning it into new resistance at 1.2254. A false breakout at this level, if GBP/USD rises, will provide a good entry point for short positions, aiming for a decline toward 1.2206. A breakout and retest of this range from below will trigger stop-loss orders, paving the way for 1.2162, signaling a return to a bearish market. The ultimate target will be the 1.2097 level, where I plan to take profits.
If demand for the pound returns in the second half of the day, and bears fail to act around 1.2254, where moving averages favor sellers, it's better to postpone shorts until resistance at 1.2303 is tested. I'll only open short positions there after a failed breakout. If there is no downward movement there, I'll look for short positions on a bounce near 1.2341, targeting a 30–35-point intraday correction.

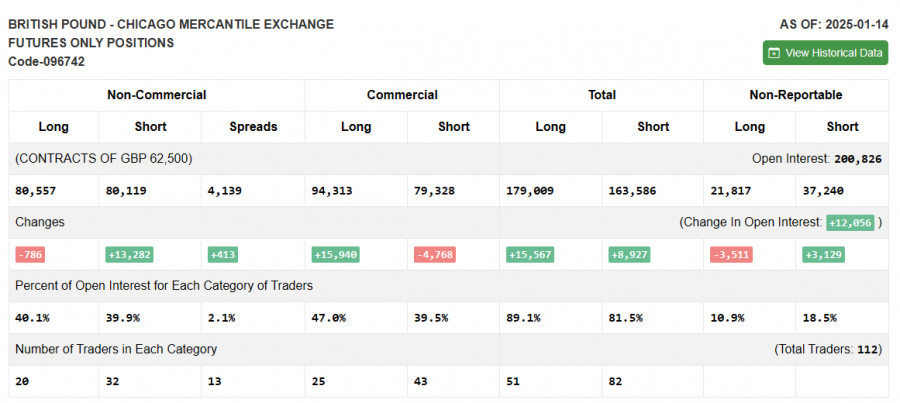
The COT report for January 14 showed a sharp increase in short positions and a reduction in long positions. A lot has changed in the balance of power. It's clear that the market is at a tipping point, with nearly equal numbers of buyers and sellers, which does not favor the former. Upcoming labor market data and reports on the UK's weak GDP growth and high inflation make the Bank of England's future rate decisions less certain. The latest COT report indicated that long non-commercial positions fell by 786 to 80,557, while short non-commercial positions increased by 13,282 to 80,119. The gap between long and short positions widened by 413.

Indicator Signals
Moving AveragesTrading occurs near the 30- and 50-period moving averages, indicating renewed pressure on the British pound.
Note: The period and prices of moving averages are based on the hourly H1 chart and differ from the traditional daily moving averages on the D1 chart.
Bollinger BandsIn case of a decline, the lower boundary of the indicator around 1.2235 will act as support.

LINKS RÁPIDOS