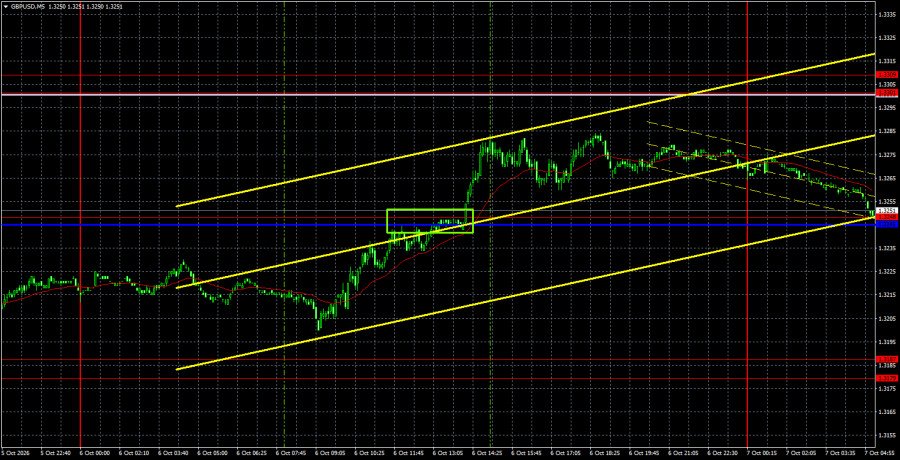
The GBP/USD currency pair also showed a decent rise on Tuesday, but that rise has virtually no impact on the overall technical picture. Since the market is not currently reacting to macro or fundamental factors (or is interpreting them only in the dollar's favor), technical analysis is the best approach because it shows what is happening in the market. What do we see on the various charts? On the hourly timeframe, we have a flat between 1.3179 and 1.3309. On the daily TF, we have a flat between 1.3190 and 1.3650. On the weekly TF we have a flat between 1.3150 and 1.3780. Sideways movement is therefore formed on the three most important timeframes. In all three cases, price sits near the lower boundary of each sideways channel. Of course that does not mean the pound must necessarily bounce from the lower boundaries of all channels and begin a strong rally. But inside a sideways channel moves can be random. To leave a sideways channel you need reasons. In our view, the dollar had no solid reasons for its month-long rise. Therefore we also do not currently see further reasons for its strengthening. The situation can change, since "black swans" have been appearing regularly in recent years — soon, it seems, they may arrive not singly but in flocks. For now we expect the British currency to rise.
Technically, the pound continues to form a downward trend despite the trendline being breached. Recall that in a flat, a trendline breach means little. A flat is a market pause and should not define the trend. Below the Senkou Span B line, the bearish bias remains.
On the 5-minute TF on Tuesday, one buy signal was generated. During the European session, price broke the 1.3245–1.3248 area, allowing traders to open long positions. Today, a bounce from that area will again allow long positions.
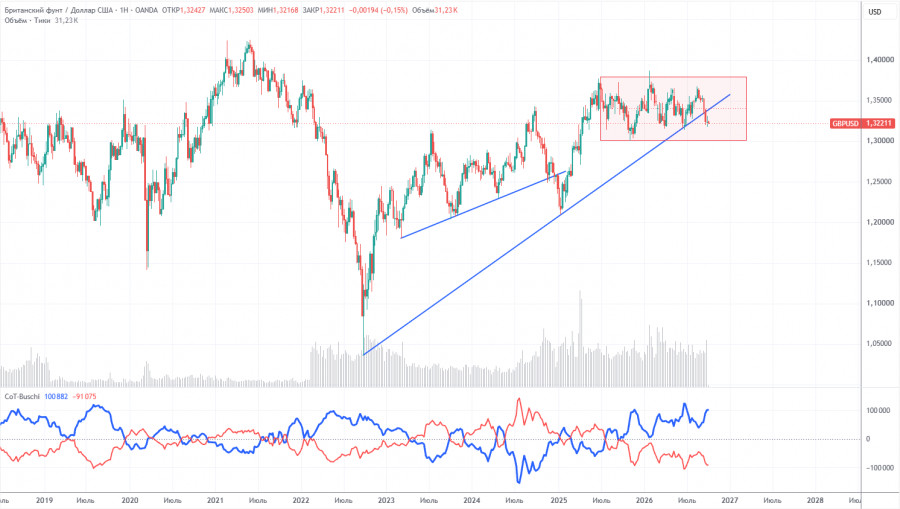
COT reports for the pound show that non-commercial traders have dominated the market with selling for several months. The net position is negative despite the long-term uptrend remaining intact. Given events in the Middle East, it is unsurprising that dollar demand remains high in 2026. The war between the US and Iran formally ended, but a new war inside Yemen has begun. The Federal Reserve's changed stance on monetary policy also supported the dollar, and the uptrend line was breached. However, it was breached under flat conditions, so we do not believe the uptrend is over.
In the long term, the dollar continues to decline due to Donald Trump's policies, which is clearly visible on the weekly TF. The trade war will continue in one form or another for a long time, and Trump's policy is aimed directly and indirectly at weakening the US currency. The long-term uptrend remains. According to the latest COT report (dated September 29), the "Non-commercial" group closed 13,100 BUY contracts and 4,500 SELL contracts. Thus, non-commercial traders' net position fell by 8,600 contracts over the week.
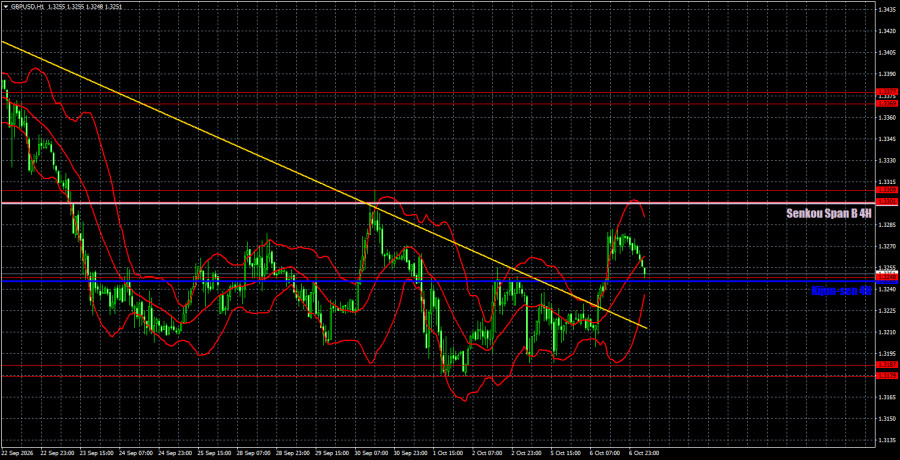
On the hourly timeframe, the GBP/USD pair continues to form a downward trend. The Fed's decision and stance have greatly changed the outlook for the US dollar and the market's attitude toward it. We would say a "black swan" has arrived twice this year and supported the dollar when no one expected it. Now a third "black swan" — in the form of the war in Yemen, which could potentially lead to a blockade of the Bab el-Mandeb strait — may arrive.
For October 7 we highlight the following important levels: 1.3042–1.3050, 1.3096–1.3115, 1.3179–1.3187, 1.3248, 1.3301–1.3309, 1.3369–1.3377, 1.3465–1.3480, 1.3588, 1.3671–1.3681. The Senkou Span B (1.3301) and Kijun-sen (1.3245) lines can also be sources of signals. It is recommended to move the Stop Loss to breakeven when the price has moved 20 pips in the correct direction. The Ichimoku indicator lines may shift during the day, which you should factor in when determining trading signals.
No important publications or events are scheduled today in the UK, while the US will publish the formal Fed minutes. We do not expect strong moves or a breakout from the sideways channel today.
Traders can consider the 1.3179–1.3187 area as a target for short positions if the price consolidates below the 1.3245–1.3248 area. A rebound from 1.3245–1.3248 would make 1.3301–1.3309 targets for long positions.

SZYBKIE LINKI
ForexMart is authorized and regulated in various jurisdictions.
(Reg No.23071, IBC 2015) with a registered office at First Floor, SVG Teachers Co-operative Credit Union Limited Uptown Building, Corner of James and Middle Street, Kingstown, Saint Vincent and the Grenadines
Restricted Regions: the United States of America, North Korea, Sudan, Syria and some other regions.









 Skontaktuj się z ForexMart