Akcie společnosti Vor Biopharma Inc (NASDAQ:VOR) vyskočily o 85 % poté, co firma oznámila exkluzivní licenční dohodu s čínskou společností RemeGen Co., Ltd. na vývoj telitaciceptu, nové fúzní bílkoviny se dvěma cíli určené k léčbě autoimunitních onemocnění.
Dohoda dává Vor Bio globální práva na vývoj a komercializaci telitaciceptu mimo Čínu, Hongkong, Macao a Tchaj-wan. Podle podmínek dohody zaplatí Vor Bio společnosti RemeGen počátečních 125 milionů USD, z čehož 45 milionů tvoří přímá platba a 80 milionů USD tvoří warranty na nákup běžných akcií. Dohoda rovněž zahrnuje potenciální regulační a komerční milníky přesahující 4 miliardy USD a odstupňované licenční poplatky.
Telitacicept je v Číně již schválen pro léčbu generalizované myasthenie gravis, systémového lupusu a revmatoidní artritidy. Terapie cílí na cytokiny BlyS a APRIL, které jsou klíčové pro přežití B buněk, čímž dochází ke snížení počtu autoreaktivních B buněk a produkce autoprotilátek. RemeGen aktuálně provádí globální klinickou studii fáze 3 s očekávanými prvními výsledky v první polovině roku 2027.
Současně s oznámením licenční smlouvy oznámila Vor Bio změnu ve vedení – Jean-Paul Kress, M.D., byl s okamžitou platností jmenován generálním ředitelem a předsedou představenstva. Nahrazuje Roberta Anga, který rezignoval, ale zůstane strategickým poradcem do října 2025.
„Jsem naprosto nadšený, že mohu vést Vor Bio v této transformaci společnosti na významného hráče v léčbě autoimunitních onemocnění,“ uvedl Dr. Kress. „Zacílení na signální dráhu BAFF/APRIL pomocí telitaciceptu představuje významný pokrok v oblasti onemocnění řízených autoprotilátkami, což tuto terapii výrazně odlišuje od ostatních přístupů.“
The EUR/USD currency pair sharply fell on Tuesday after failing to break above the 1.1786 mark. As before, geopolitical factors played a significant role. Donald Trump stated late Monday that the deal with Iran is under threat of collapse, and the sides cannot agree on the terms of a peace agreement. Trump has decided not to withdraw from negotiations, but it is clear that war in the Middle East could resume at any moment. Against this understanding, demand for the US currency began to rise again. We do not believe the dollar can form a whole new trend, but individual geopolitical events might still support it. Significant strengthening of the American currency should only be expected in the event of a full-scale war in the Middle East.
On the hourly timeframe, it is evident that the 1.1786 level was too much for the bulls to handle. Currently, the price is still holding above the Senkou Span B line, maintaining upward prospects. However, if geopolitical factors continue to deteriorate, the pair is bound to decline. In this case, the trend on the hourly timeframe will shift back to a downward trend.
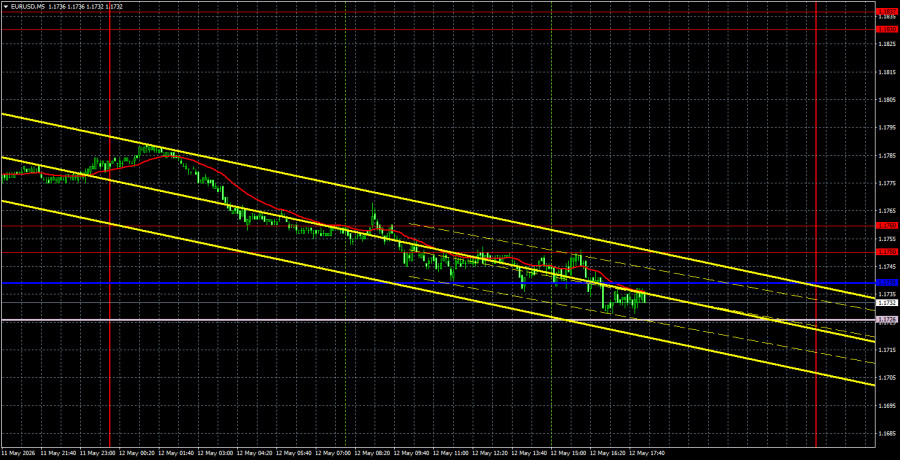
On the 5-minute timeframe, the pair moved lower throughout the day, but profits were hard to realize. The first signal was formed when the price consolidated below the 1.1750-1.1760 area, but the Ichimoku indicator lines were already below it, so opening short positions made little sense. These lines were not breached until the evening.
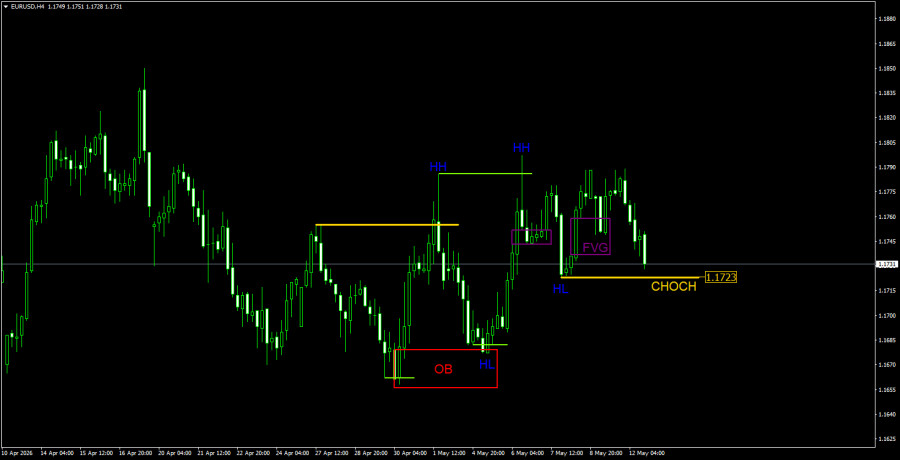
On the 4-hour timeframe, according to the ICT trading system, the situation is quite clear as well. There is an upward trend, with the CHOCH line at 1.1723; only below this level can we consider the upward momentum exhausted. As long as the upward trend persists, we will focus only on bullish patterns, signals, and liquidity grabs. Just yesterday, a liquidity grab for buying occurred. Therefore, a new wave of upward movement may begin today. However, to execute this, new bullish patterns are needed. If liquidity grabs do not occur, the decline may continue, and in that case, the upward trend will be broken. A downward trend will begin, and traders will be able to consider bearish patterns for opening short positions.
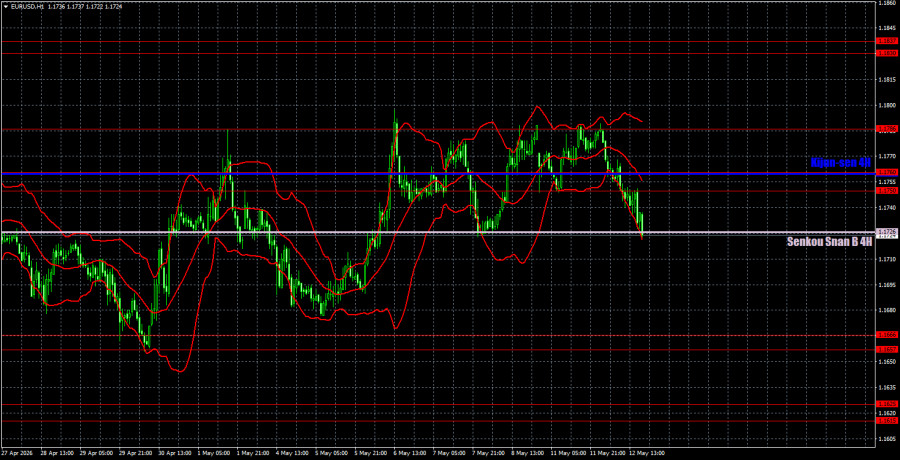
On the hourly timeframe, the EUR/USD pair maintains an upward trend. The situation in the Middle East remains tense, but it is not getting significantly worse; therefore, there are no strong reasons to further strengthen the US dollar. The dollar had every opportunity to show growth on Friday, but the market once again ignored important macroeconomic reports. The only potential hindrance to the pair's further rise could be geopolitical factors.
For May 13, we highlight the following trading levels: 1.1362, 1.1426, 1.1542, 1.1615-1.1625, 1.1657-1.1666, 1.1750-1.1760, 1.1830-1.1837, and 1.1907-1.1922, as well as the Senkou Span B line (1.1726) and Kijun-sen line (1.1760). The Ichimoku indicator lines may move during the day, which should be taken into account when determining trading signals. Don't forget to set a Stop Loss order to break even if the price moves 15 pips in the correct direction. This will protect against potential losses if the signal turns out to be false.
On Wednesday, the EU will publish reports on industrial production and GDP, along with the US Producer Price Index. We consider all three reports to be secondary and do not expect a market reaction to them. Yesterday, another important inflation report was published, but the market again ignored it.
Today, traders may open short positions if the price consolidates below the Senkou Span B line, targeting the 1.1657-1.1666 area. Long positions can be opened if the price does not break below the Senkou Span B line, targeting 1.1750-1.1760 and 1.1786.

SZYBKIE LINKI
ForexMart is authorized and regulated in various jurisdictions.
(Reg No.23071, IBC 2015) with a registered office at First Floor, SVG Teachers Co-operative Credit Union Limited Uptown Building, Corner of James and Middle Street, Kingstown, Saint Vincent and the Grenadines
Restricted Regions: the United States of America, North Korea, Sudan, Syria and some other regions.


 Skontaktuj się z ForexMart