The EUR/USD currency pair paused on Monday to reflect and then moved north again. Overall, it can't be said that any new events triggered the dollar's decline on the first trading day of the week. Certainly, there were new developments. For instance, Trump unleashed a new barrage of claims and insults against Canada and its Prime Minister, Mark Carney, and threatened with 100% tariffs if Ottawa signs a free trade agreement with China. Canada has no intention of signing such an agreement, yet Trump still unleashed new aggression. The market observed this and concluded that it should continue selling the dollar. Even the report on US durable goods orders, which turned out to be significantly better than expected, had no positive impact on the dollar. However, as we mentioned earlier, the macroeconomic backdrop is currently being ignored by the market. There are sufficient global, fundamental reasons to continue selling the US currency.
Additionally, global technical factors emerged just yesterday. After a seven-month range, the EUR/USD pair finally broke out of the sideways channel of 1.1400-1.1830, indicating that the upward trend of 2025 has resumed. Of course, this does not mean that the dollar will fall every day from now on, but even the technical indicators suggest that the euro is on the rise, virtually without alternatives.
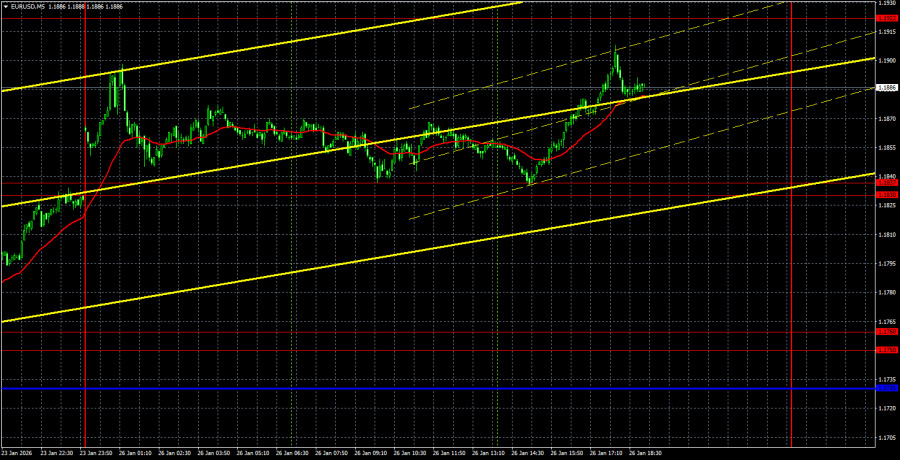
On the 5-minute timeframe, we added another level at 1.1837 yesterday, making it a range. We did not mark trading signals in this area because we had not previously mentioned the 1.1837 level. However, it might serve as a source of trading signals in the future.
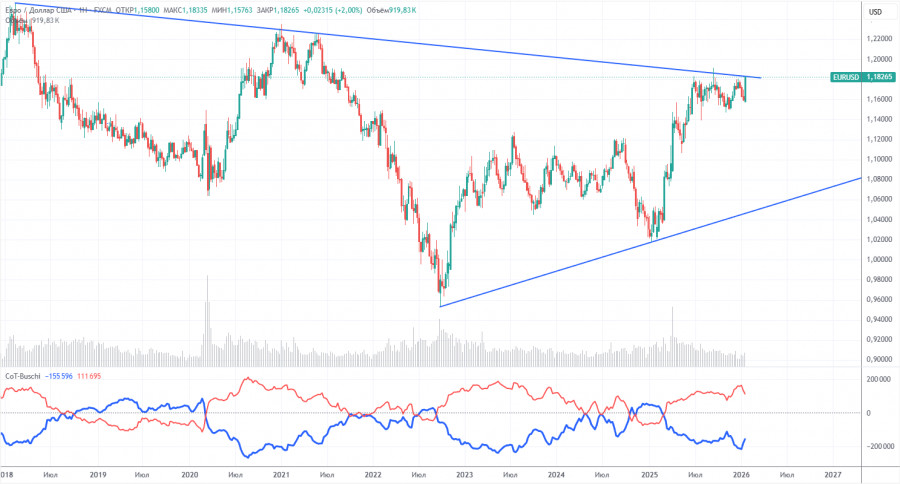
The last COT report is dated January 20. The illustration above clearly shows that the net position of non-commercial traders remains "bullish." Since Trump took office for his second term, the dollar has been the only currency to decline. We cannot say with 100% certainty that the dollar's decline will continue, but current developments around the world suggest this is likely.
We still do not see any fundamental factors supporting the strengthening of the euro, but there remains enough to support the decline of the American currency. The global downward trend remains intact; however, it is important to note where the price has moved over the last 18 years. A new upward trend has been forming over the past three years, and in the coming weeks, the price might break through the global descending trend line, confirming further long-term growth.
The positioning of the red and blue lines of the indicator continues to indicate the maintenance of a "bullish" trend. During the last reporting week, long positions among the "Non-commercial" group decreased by 8,400, while short positions increased by 12,600. Consequently, the net position declined by 21,000 contracts for the week.
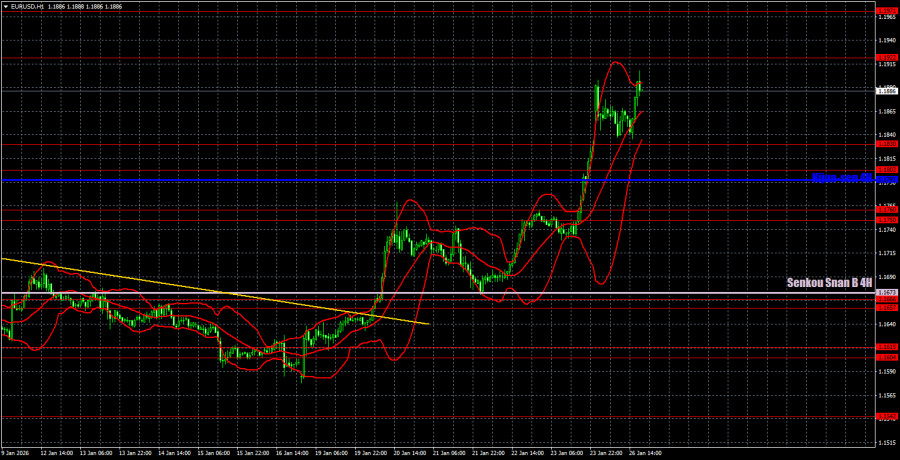
On the hourly timeframe, the EUR/USD pair continues to form a new upward trend. Yesterday, the pair officially exited the sideways channel of 1.1400-1.1830, where it had spent seven months. Thus, we still expect the euro to continue growing in the near future. As we mentioned, the trade war will only escalate, and Trump will continue to use tariffs as his main tool to advance his interests.
On January 27, we highlight the following levels for trading: 1.1234, 1.1274, 1.1362, 1.1426, 1.1542, 1.1604-1.1615, 1.1657-1.1666, 1.1750-1.1760, 1.1830-1.1837, 1.1922, 1.1971-1.1988, as well as the Senkou Span B line (1.1673) and Kijun-sen line (1.1792). The Ichimoku indicator lines may shift throughout the day, which should be taken into account when determining trading signals. Don't forget to set the Stop Loss order to break-even if the price moves in the correct direction by 15 pips. This will protect against potential losses if the signal turns out to be false.
On Tuesday, ECB President Christine Lagarde is scheduled to speak in the Eurozone, and in the US, the ADP report on the labor market will be released. Neither event will significantly impact trader sentiment. Lagarde is unlikely to share anything new with traders, and the ADP report is now released every week, significantly reducing its importance.
On Tuesday, traders may trade from the 1.1830-1.1837 area or from the 1.1922 level. New longs become relevant on rebounds from the area or breakouts above the level. Short positions can be considered on breakouts below the area or rebounds from the level.

SZYBKIE LINKI
ForexMart is authorized and regulated in various jurisdictions.
(Reg No.23071, IBC 2015) with a registered office at First Floor, SVG Teachers Co-operative Credit Union Limited Uptown Building, Corner of James and Middle Street, Kingstown, Saint Vincent and the Grenadines
Restricted Regions: the United States of America, North Korea, Sudan, Syria and some other regions.


 Skontaktuj się z ForexMart