On Monday, the EUR/USD currency pair traded much more calmly compared to Friday. Recall that Friday—and indeed the whole of last week—was packed with significant fundamental and macroeconomic events. Moreover, some of them, as the saying goes, have long-term consequences. What do we mean? For example, the ISM Services PMI is released, and its reading is low. The market simply reacts to that figure, and that's it. Then the NonFarm Payrolls report comes out, which also disappoints. The market responds to the report, but at the same time makes a grim forecast regarding the Federal Reserve's monetary policy in the coming months.
Thus, the dollar didn't just collapse on Friday under the weight of dismal labor market data. The market now expects rate cuts as early as September, despite strong skepticism about such a move before the NFP report. And in principle, doubts remain. After all, no one knows which issue the U.S. central bank will prioritize: the labor market or inflation. Remember, to keep inflation even at current levels, interest rates cannot be lowered. To stimulate the labor market and the economy, however, the key rate must be cut. So how can we be sure what choice the Fed will make?
Also, recall that price stability and full employment are two essentially equal mandates for the central bank. That is, we can't say that price stability is more important than full employment or vice versa. Therefore, we continue to doubt that the Fed will resume monetary easing in September. However, we acknowledge that the real probability of a rate cut at the next meeting has increased significantly following Friday's data.
There is nothing positive in this for the U.S. dollar. The American currency was plunging for the first six months of 2025—even when the Fed wasn't hinting at rate cuts and there were no grounds for expecting policy easing. Jerome Powell reminded the markets nearly every week that Donald Trump's tariff policy would inevitably accelerate inflation, meaning the Fed had no room to pursue easing. So if the Fed does resume cutting the key rate in the near term, what kind of market reaction should we expect?
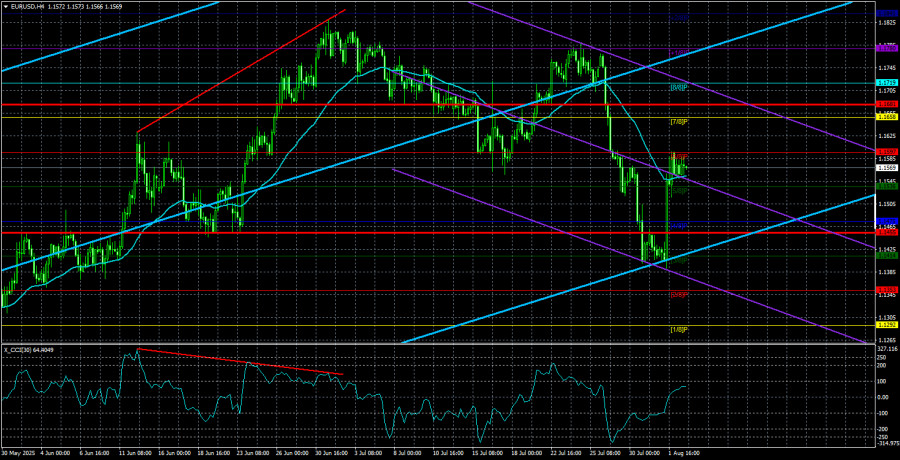
Therefore, at this point, we believe the EUR/USD pair may hover at current levels, possibly decline slightly, but in the medium term, is likely to resume its upward movement. On the daily timeframe, it's visible that the price rebounded from the Senkou Span B line, which is a strong support level. In our view, the fundamental backdrop has not improved significantly for the dollar over the past month to justify expectations of further strengthening. Of course, the Senkou Span B line is not a panacea—it will eventually be broken. But when that happens, then it will be reasonable to take the prospects of a dollar rally more seriously. For now, we've only seen a relatively minor correction (on the daily scale), which may already be over.
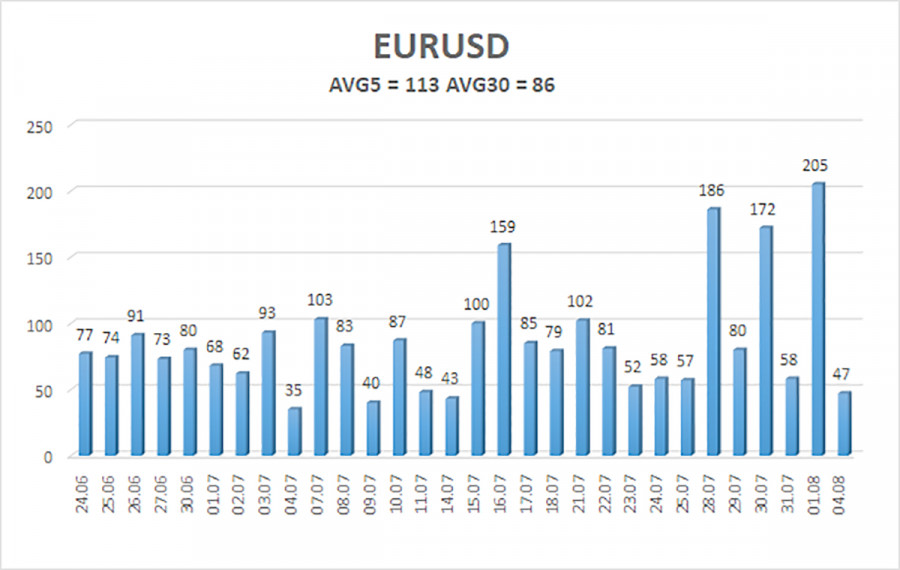
The average volatility of the EUR/USD pair over the last five trading days as of August 5 is 113 pips, classified as "high." We expect the pair to move between the levels of 1.1455 and 1.1681 on Tuesday. The long-term linear regression channel is still pointing upward, which continues to indicate an uptrend. The CCI indicator has entered the oversold area for the third time, once again signaling a potential resumption of the bullish trend.
S1 – 1.1536
S2 – 1.1475
S3 – 1.1414
R1 – 1.1597
R2 – 1.1658
R3 – 1.1719
The EUR/USD pair may resume its upward trend. Trump's policies continue to exert strong pressure on the U.S. dollar. And last week, the entire world witnessed the consequences of those policies. The dollar rose as much as it could, but now, it seems, the time has come for another prolonged decline. If the price is below the moving average, small short positions can be considered with targets at 1.1475 and 1.1455. Above the moving average, long positions remain relevant with targets at 1.1658 and 1.1681 in continuation of the trend.
Linear Regression Channels help determine the current trend. If both channels are aligned, it indicates a strong trend.
Moving Average Line (settings: 20,0, smoothed) defines the short-term trend and guides the trading direction.
Murray Levels act as target levels for movements and corrections.
Volatility Levels (red lines) represent the likely price range for the pair over the next 24 hours based on current volatility readings.
CCI Indicator: If it enters the oversold region (below -250) or overbought region (above +250), it signals an impending trend reversal in the opposite direction.

SZYBKIE LINKI
ForexMart is authorized and regulated in various jurisdictions.
(Reg No.23071, IBC 2015) with a registered office at First Floor, SVG Teachers Co-operative Credit Union Limited Uptown Building, Corner of James and Middle Street, Kingstown, Saint Vincent and the Grenadines
Restricted Regions: the United States of America, North Korea, Sudan, Syria and some other regions.


 Skontaktuj się z ForexMart