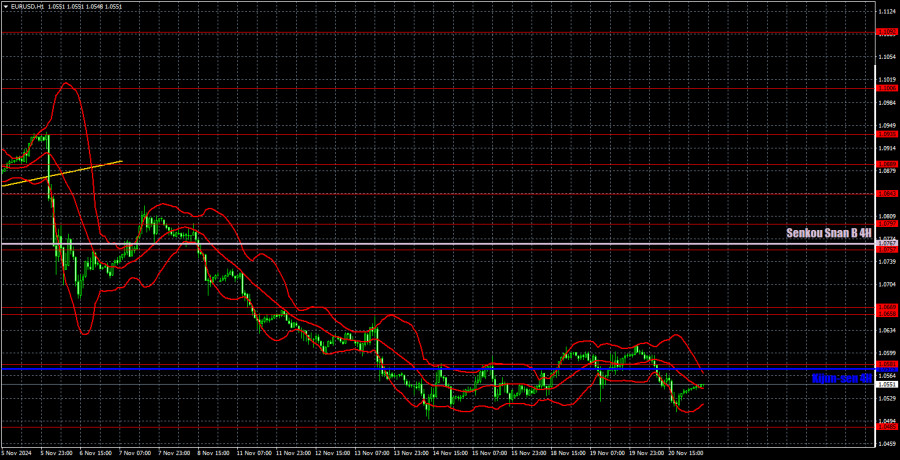

The EUR/USD currency pair continued trading flat on Wednesday. As noted earlier, the pair has entered a consolidation phase due to a lack of buyers in the market and a pause taken by sellers. It's difficult to predict how long this flat period will last, but it's likely not a good time to trade within such a range. The horizontal channel has no clear boundaries, although a mild upward momentum is present. However, this movement cannot be considered a genuine upward correction. For now, waiting seems to be the best strategy.
Macroeconomic and fundamental events on Wednesday were negligible. A few minor reports were released but did not influence the pair's movements. This week, in general, is light on significant news, which explains the lack of direction. While we believe that the euro will decline in the medium term, occasional pauses are natural and beneficial for the market.
Among yesterday's trading signals, the price breaking below the 1.0581 level and the Kijun-sen line was notable, leading to a downward move of about 50 pips. However, within a flat market, Ichimoku indicator lines lose their strength. The price essentially ignored the next support level at 1.0533. While trading signals can still be sought, raising the bar for their reliability in such conditions is important.

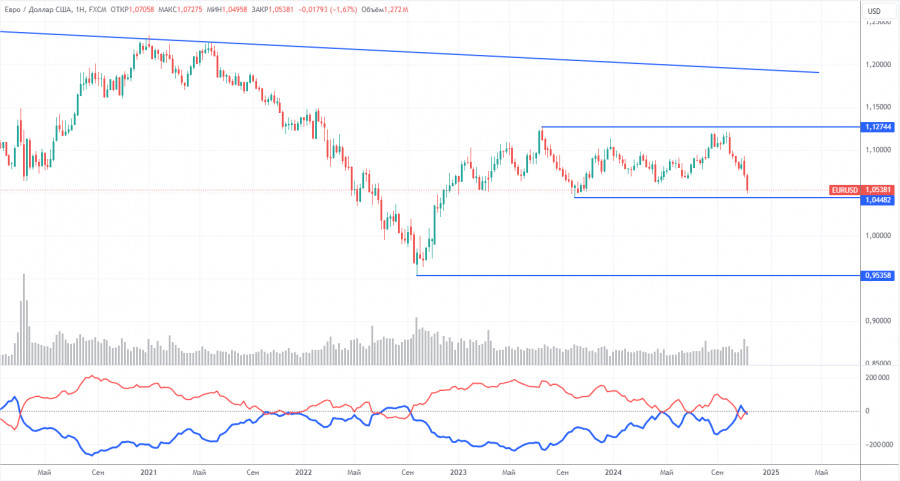
The latest COT report, dated November 12, shows that the net position of non-commercial traders has remained bullish for a long time. The last attempt by bears to gain dominance failed. However, a month ago, professional traders significantly increased their short positions, leading to the net position turning negative for the first time in a long period. This indicates that the euro is now being sold more frequently than bought.
We still see no fundamental reasons for strengthening the euro, and technical analysis suggests the price remains in a consolidation zone—essentially a flat trend. On the weekly timeframe, it's clear that since December 2022, the pair has traded between 1.0448 and 1.1274. The market has transitioned from a seven-month flat phase to a 22-month phase. Thus, further decline remains likely toward 1.0448, which is only a short distance away.
Over the last reporting week, the number of long positions among the non-commercial group increased by 100, while short positions decreased by 14,100, causing the net position to grow by 14,200. The euro's downside potential remains significant.

On the hourly timeframe, the pair continues its downward trend. There's no need to elaborate on the fundamental and macroeconomic reasons behind the euro's medium-term decline—they remain unchanged. In the medium term, further euro depreciation is expected. It's becoming increasingly clear that the market has fully priced in the Federal Reserve's monetary policy easing cycle. Additionally, the Fed shows no urgency in cutting rates further, making even minor upward corrections for the euro challenging.
For November 21, we highlight the following levels for trading: 1.0340-1.0366, 1.0485, 1.0581, 1.0658-1.0669, 1.0757, 1.0797, 1.0843, 1.0889, 1.0935, 1.1006, as well as the Senkou Span B (1.0767) and Kijun-sen (1.0575) lines. The Ichimoku lines may shift throughout the day, so they should be monitored for generating valid trading signals. Remember to use a Stop Loss order to secure breakeven if the price moves 15 pips in the intended direction to mitigate potential losses from false signals.
The economic calendar for Thursday offers little to focus on. In the U.S., minor reports such as unemployment claims and new home sales will be released, but these are unlikely to drive significant market movement or push the pair out of its flat range. Flat trading will probably persist.
Support and resistance levels: thick red lines around which movement may end. They are not sources of trading signals.
Kijun-sen and Senkou Span B lines: Ichimoku indicator lines transferred from the 4-hour to the 1-hour timeframe. These are strong lines.
Extreme levels: thin red lines where the price previously rebounded. They are sources of trading signals.
Yellow lines: Trend lines, trend channels, and other technical patterns.
Indicator 1 on COT charts: The net position size for each category of traders.

SZYBKIE LINKI