
Trade Review and Tips for Trading the Japanese Yen
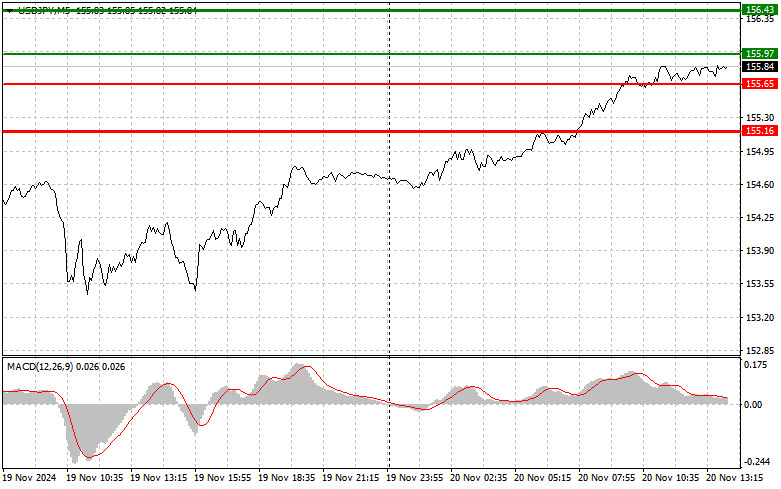
The price test at 155.64 in the first half of the day occurred as the MACD indicator had risen significantly above the zero line, limiting the pair's upward potential. For this reason, I did not buy the dollar. With the Fed shifting toward a more hawkish stance, the dollar continues to rise against the Japanese yen. This rise is driven by several factors, including changes in monetary policy, strong US economic indicators, and sustained demand for the US dollar. Meanwhile, the Japanese economy faces challenges such as low inflation and slowing growth. These factors compel the Bank of Japan to maintain its current policy, hinting only at distant rate hikes, which further pressures the yen. Only new statements from Japanese policymakers could interrupt the bullish trend in the USD/JPY pair. For today's intraday strategy, I will implement Scenarios #1 and #2..
Scenario #1:Buy USD/JPY at 155.97 (green line on the chart), targeting 156.43. At 156.43, close the position and consider selling, expecting a 30-35 point pullback. The pair's uptrend is likely to continue.Note: Before buying, ensure the MACD indicator is above the zero line and starting to rise.
Scenario #2:Buy USD/JPY if the price tests 155.65 twice while the MACD indicator signals oversold conditions. This setup would limit the pair's downward potential and likely trigger a reversal. Target levels are 155.97 and 156.43.
Scenario #1:Sell USD/JPY after the price breaks below 155.65 (red line on the chart), aiming for 155.16. At 155.16, close the position and consider buying, expecting a 20-25 point rebound. Selling pressure is likely to increase if the Fed adopts a hawkish stance.Note: Before selling, ensure the MACD indicator is below the zero line and starting to decline.
Scenario #2:Sell USD/JPY if the price tests 155.97 twice while the MACD indicator signals overbought conditions. This setup would limit the pair's upward potential and likely trigger a reversal. Target levels are 155.65 and 155.16.

Important:Beginner Forex traders should exercise caution when entering the market. Avoid trading during major fundamental news releases to prevent losses from sharp price fluctuations. If trading during news events, always use stop orders to minimize potential losses. Without stop orders, you risk losing your deposit quickly, especially when trading large volumes without proper money management. Remember, successful trading requires a clear plan, like the one outlined above. Spontaneous decisions based on current market conditions often lead to losses for intraday traders.

SZYBKIE LINKI