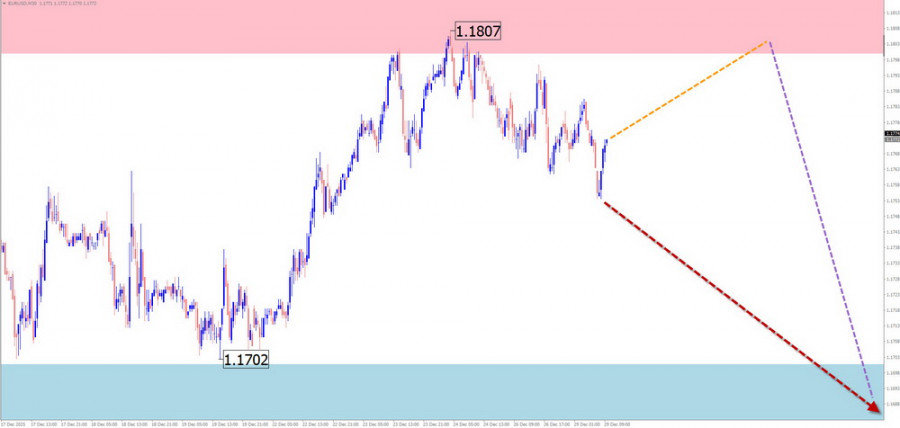
EUR/USD
When analyzing the euro market, the focus remains on the upward wave that began on August 26 of this year. From a strong potential reversal zone over the past month, prices have been forming a corrective extended flat. The correction structure lacks its final part (C), while the middle part (B) is nearing completion. Price is moving along the upper boundary of a powerful potential reversal zone.
In the coming week, the euro is expected to maintain a generally sideways price pattern. After a probable attempt to pressure the resistance zone in the early days, a change in direction and a decline in the pair's price toward the calculated support boundaries can be expected.
Resistance:
Support:
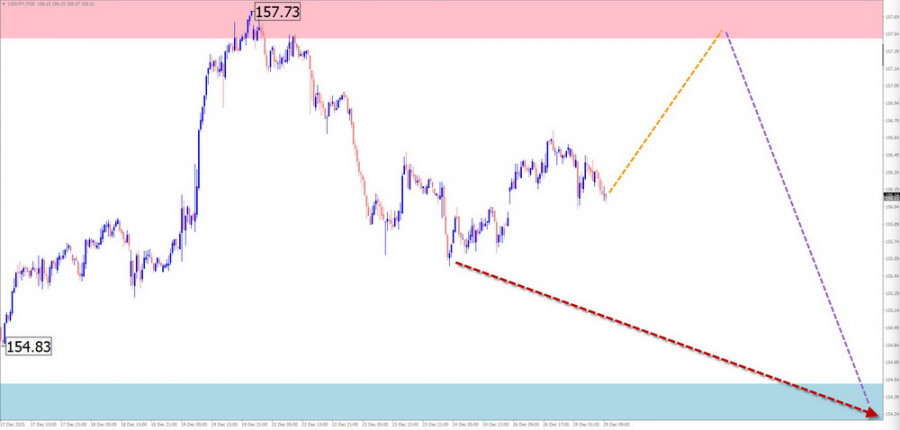
USD/JPY
On the chart of the main Japanese yen pair, an upward wave has been forming since early August. Counter to the main trend, a hidden correction has been developing since early October in the form of an extended/shifted flat. The structure lacks its final part (C). The downward movement from December 22 has reversal potential.
In the coming days, the yen price is expected to continue moving within a sideways range. A pullback toward the resistance zone is possible, with short-term pressure on its upper boundary. After that, a reversal formation and the beginning of a downward price movement can be expected.
Resistance:
Support:
GBP/JPY
On the chart of the GBP/JPY pair, the upward wave that began in April has not yet been completed. Within its structure, the final part of the wave (C) is nearing completion. The pair's price is approaching the lower boundary of a higher-timeframe reversal zone. No ready signals of a trend change are currently observed on the chart.
During the coming week, the completion of the sideways sentiment is expected, with a decline in price down to the support boundaries. After that, a change in direction and the start of an upward movement in the pair can be anticipated.

Resistance:
Support:
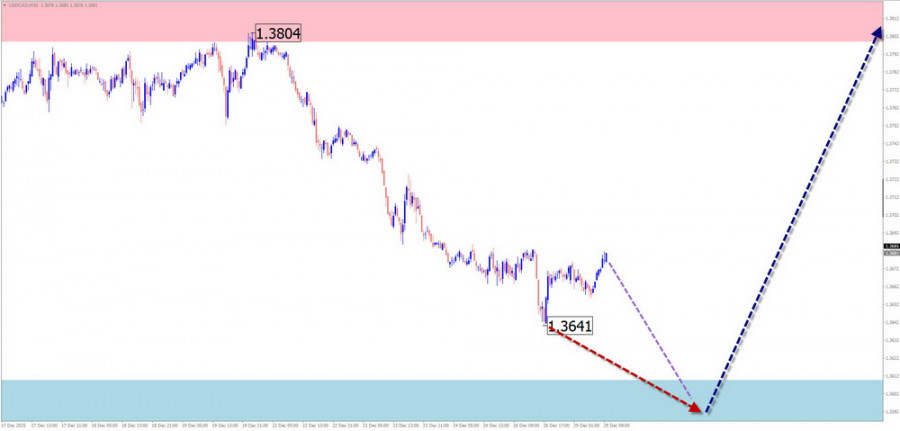
USD/CAD
The direction of price movements on the Canadian dollar major has been defined by a downward wave trend since February. The final part (C) is forming within its structure. During this phase, the price has reached the upper boundary of another potential reversal zone.
Throughout the current week, continuation of the general sideways movement of the pair is expected. A downward vector is likely over the next couple of days. Price declines can be expected toward the support boundaries. A reversal formation and the start of price growth can be expected already next year.
Resistance:
Support:
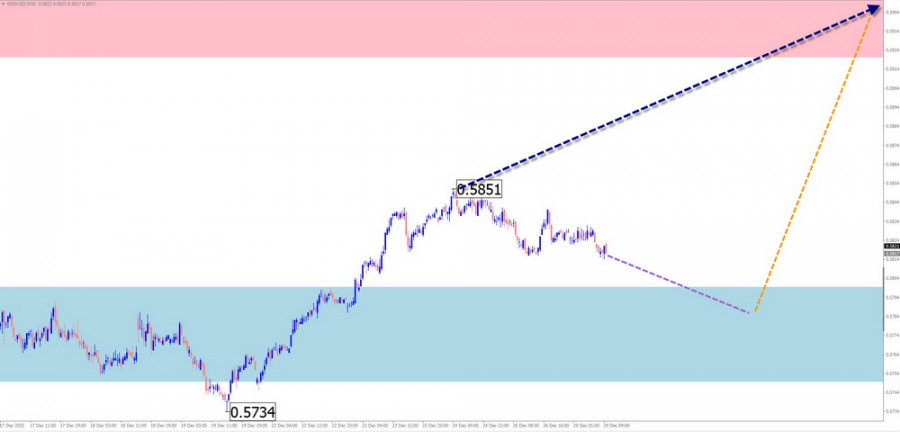
NZD/USD
Quotes of the New Zealand dollar major pair continue to fluctuate within the upward wave zigzag that began in early April. Within the structure, price movements since November 21 form the final part (C). Structural analysis indicates that the completion of its first part (A) is approaching.
In the early days of the coming week, continuation of the bearish movement is expected, up to its full completion near the calculated support. After that, a flat and short-term sideways movement is possible. Toward the end of the week, price growth can be expected, but not above resistance levels.
Resistance:
Support:
Gold
Gold price movements follow the algorithm of the dominant long-term uptrend of recent years. Since late October, prices have been pulling back, forming a correction of the last trend leg. Structural analysis indicates the formation of an extended/shifted flat. The middle part (B) is approaching the final phase of its development.
In the first days of the coming week, there is a high probability of continued sideways movement in gold. An upward vector is possible, with pressure on the resistance zone. After that, renewed activity, a change in direction, and another decline down to the support zone boundaries can be expected.

Resistance:
Support:
Explanations:
In simplified wave analysis (SWA), all waves consist of three parts (A–B–C). On each timeframe, the latest unfinished wave is analyzed. Expected movements are shown with dashed lines.
The wave algorithm does not take into account the duration of instrument movements over time.
ForexMart is authorized and regulated in various jurisdictions.
(Reg No.23071, IBC 2015) with a registered office at First Floor, SVG Teachers Co-operative Credit Union Limited Uptown Building, Corner of James and Middle Street, Kingstown, Saint Vincent and the Grenadines
Restricted Regions: the United States of America, North Korea, Sudan, Syria and some other regions.


 コンタクトする