Dalším významným hráčem byl Disney, a to na základě reakce na své výsledky. Ve středu tento mediální a zábavní gigant překonal konsenzuální odhady analytiků ohledně zisku a tržeb, přičemž jeho celoroční výhled EPS byl rovněž nad očekáváním.
Akcie Disney vzrostly v den po zveřejnění výsledků o více než 10 %.
„I když makroekonomické obavy přetrvávají, ukazatele rozhodně naznačují silný fiskální rok 2025 a ještě lepší fiskální rok 2026,“ uvedl Bernstein, který zachoval hodnocení ‚Outperform‘ pro akcie společnosti. “Segment zážitků vykazuje známky síly na domácím trhu, a to i přes přetrvávající makroekonomickou nejistotu. Rezervace na nadcházející léto jsou vyšší, a to i přes krátkodobé nepříznivé vlivy ze strany EPIC Universet.“
On Thursday, the EUR/USD currency pair didn't even attempt to continue its illogical downward movement. For the second day in a row, price action moved sideways with minimal volatility. There was once again no macroeconomic or fundamental news, leaving traders with nothing to react to for a fourth consecutive day.
However, on Thursday, it was officially confirmed that the U.S. inflation report—originally in question due to the ongoing government shutdown—would indeed be published today. The fact that this news almost went unnoticed speaks volumes. The shutdown has become such a familiar occurrence this October that even the dollar remains unaffected. Since the beginning of the shutdown, most U.S. statistical releases, especially employment-related data, have been suspended, and inflation data has also been in doubt.
From a technical standpoint, there's little new to report. Over a week ago, the pair broke above the descending trendline, initiated an upward trend... and immediately ended it. For an entire week, the price has been declining without any fundamental justification. Growth prospects for the euro remain, but so does the broader flat on the daily timeframe. As a result, market participants may continue to observe low volatility and irrational price movements for quite some time.
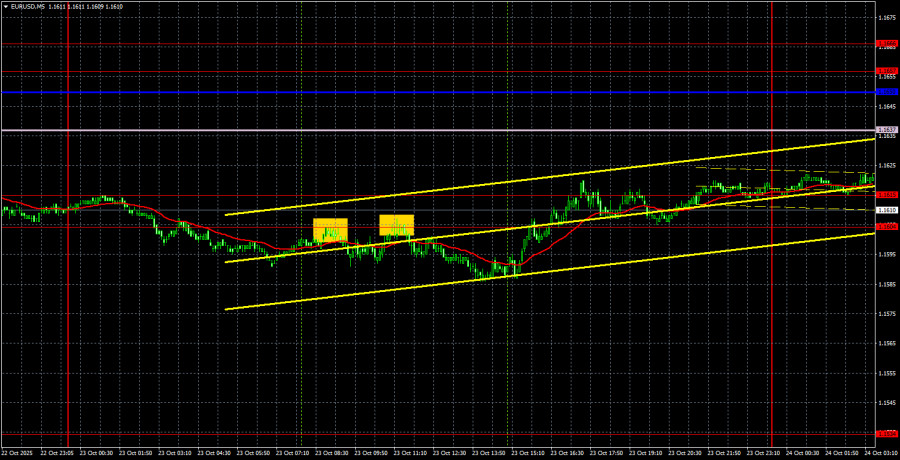
On the 5-minute chart, two trade signals formed on Thursday. During the European session, the price bounced twice from the 1.1604 level, moved down an absurd 10 pips, and that was the end of any meaningful price action. As previously warned, Thursday was unlikely to produce significant movement.
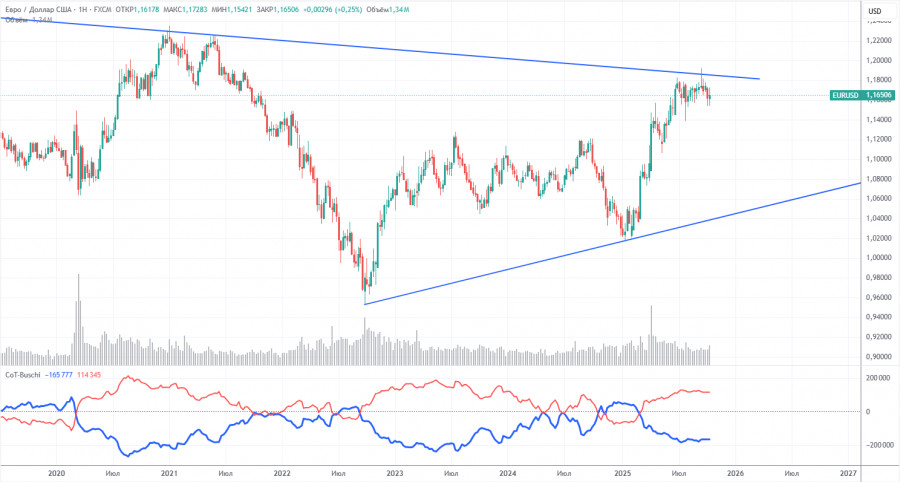
The last COT (Commitments of Traders) report is dated September 23. No further reports have been released due to the U.S. government shutdown. As seen on the chart, the net position of non-commercial traders had remained bullish for a long time, with bears briefly taking control at the end of 2024—only to lose it again quickly.
Since Trump took office for a second term, the dollar has been steadily declining. While we cannot say with absolute certainty that this trend will continue, the global landscape suggests this outcome.
At present, we don't see any strong fundamental drivers favoring the euro, but there are still sufficient reasons for the U.S. dollar to weaken. The global downtrend in the dollar remains in place, although given the prolonged period of range-bound trading, recent developments seem increasingly disconnected from prior long-term trends.
If Trump continues his trade wars and the Federal Reserve appears at risk of losing independence, this would add serious pressure to the dollar in the longer term. The red and blue lines on the COT indicator still reflect a structurally bullish trend. During the last available reporting week, non-commercial longs declined by 800 contracts, while shorts increased by 2,600, reducing net positioning by 3,400 contracts. However, these figures are now outdated and of limited relevance in current conditions.
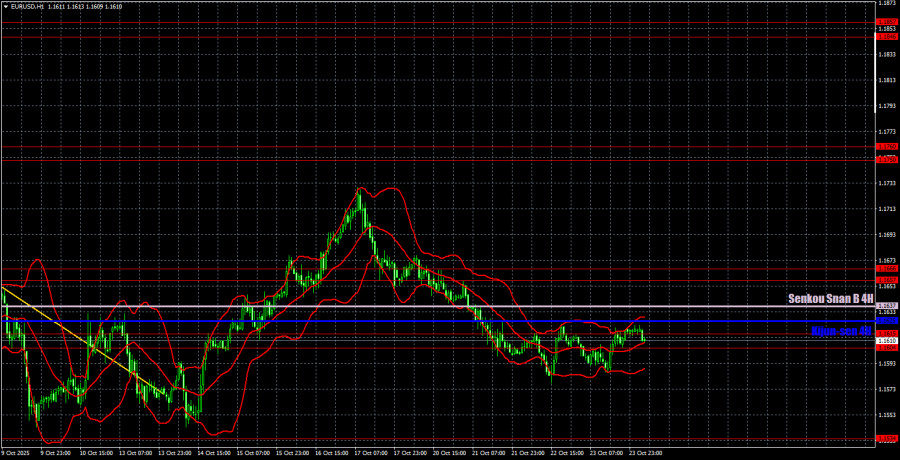
On the hourly chart, EUR/USD may have completed its downward trend as early as two weeks ago. However, the euro has continued to fall steadily in recent days, and there's still no rational explanation beyond science fiction. We maintain that the primary cause of these inefficient moves is the flat on the daily time frame, which remains intact.
Support and resistance levels for October 24 include: 1.1234, 1.1274, 1.1362, 1.1426, 1.1534, 1.1604–1.1615, 1.1657–1.1666, 1.1750–1.1760, 1.1846–1.1857, 1.1922, 1.1971–1.1988. Also: Senkou Span B (1.1637) and Kijun-sen (1.1625) — both from the Ichimoku indicator, transferred from the 4-hour to the 1-hour chart. Keep in mind: these Ichimoku levels can shift throughout the session, so be sure to update them accordingly when generating trade signals. Also, don't forget to set Stop Loss to breakeven once the price has moved 15 pips in the correct direction — this helps protect against false breakouts.
Today, PMI data for October will be released in the Eurozone, Germany, and the U.S. Additionally, the highly anticipated U.S. September inflation report—the "report of the week"—will be published. As a result, market volatility may be significantly higher today than in recent sessions.
On Friday, traders can once again focus on the 1.1604–1.1615 zone as the starting point for any positioning, as no clearer levels are currently available. To open long positions, the price must consolidate above this range, with a target at 1.1657. Short positions can be considered on a bounce from this zone (from below), targeting 1.1534.
Thick red lines represent resistance/support levels — they are not trade signals but indicate possible price pivots
Senkou Span B and Kijun-sen lines — from the Ichimoku indicator, adapted to the 1-hour chart from H4; these are strong dynamic levels
Thin red lines represent local extremums from which price previously reversed — they may serve as minor signal points
Yellow lines indicate trendlines, channels, or technical patterns
COT Indicator #1 — shows the size of net positions held by different trader groups
ForexMart is authorized and regulated in various jurisdictions.
(Reg No.23071, IBC 2015) with a registered office at First Floor, SVG Teachers Co-operative Credit Union Limited Uptown Building, Corner of James and Middle Street, Kingstown, Saint Vincent and the Grenadines
Restricted Regions: the United States of America, North Korea, Sudan, Syria and some other regions.


 コンタクトする