The one-hour (H1) chart for Bitcoin (#Bitcoin) reveals a sharp, aggressive downward price movement. Currently trading at 77,484.16, the price has sustained a decline that broke through several technical support
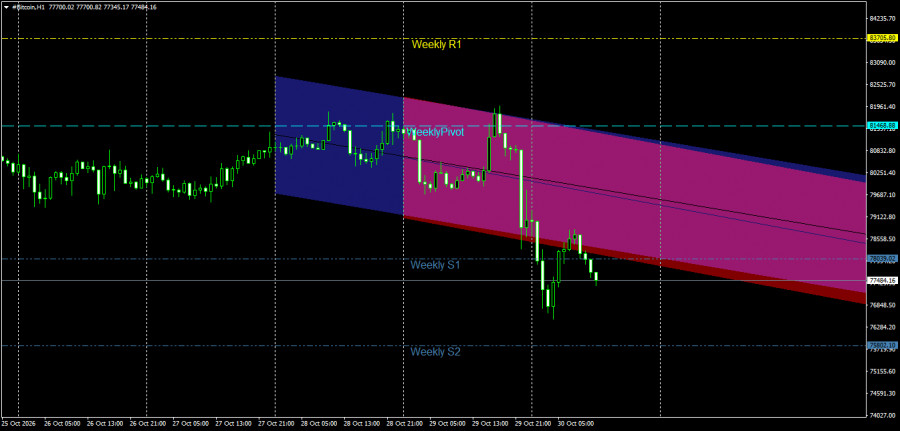
The one-hour (H1) chart for Bitcoin (#Bitcoin) reveals a sharp, aggressive bearish trend, with the downward momentum accelerating. Currently trading at 77,484.16, the price has sustained a decline that broke through several key technical support levels and vital pivot points—a clear indication that selling pressure dominates and the "bears" are in control of the short-term market movement.
Technical Analysis and Price Action
Price Channel Structure: The price is moving within a broad, primary descending channel (in blue), which reflects the overall negative trend. Overlaid on this is a steeper, secondary descending channel (in pink) that exerts direct downward pressure, driving the price toward a succession of new lows. Notably, the price is currently positioned near the lower boundaries of these channels, showing minor fluctuations as it attempts to establish a temporary support base following a rebound from the most recent local low.
Interaction with Pivot and Resistance Levels: The price faced early downward pressure after failing to hold above key pivot levels—specifically the weekly pivot point at 81,468.88—as well as the upper resistance level (Weekly R1). As a result of these pressures, the price broke below the support lines, trading beneath key support levels. It moved toward the first weekly support level (Weekly S1)—located near 78,039.02—which was temporarily breached before the price attempted to stabilize near its current levels.
Pivotal Support and Resistance Levels.
Key Resistance Levels:
First Resistance: 78,500.00 (an intraday resistance level and the previously broken floor of the sub-channel).
Second Resistance: 80,000.00 (a major psychological barrier and an area where reversals have previously occurred).
Pivotal Resistance: 81,468.88 (the Weekly Pivot point, which serves as a trend-defining boundary).
Key Support Levels:
First Support: 77,000.00 (a psychological barrier, the current intraday trading focal point, and the present support level).
Second Support: 75,802.10 (the second weekly support level, Weekly S2).
Major Support: The 74,500.00 area and below, should the price collapse continue and selling momentum intensify.
Price Action Outlook and Trading Recommendations.
Bearish Scenario (Primary):
The negative trend remains dominant and is the most likely outcome as long as the price continues to trade below the nearby resistance levels and the Weekly Pivot point. Recommendation: It is advisable to sell into any corrective upward rebound toward the 78,500.00 – 80,000.00 range, provided these levels continue to cap any price advances.
Technical Targets: Aim for the psychological support level at 77,000.00, followed by an extension toward the second weekly support level at 75,802.10.
Corrective Bullish Scenario (Alternative):
This scenario is triggered if significant buying pressure emerges, successfully lifting prices from current lows and breaking through technical resistance levels.
Confirmation Condition: A clear hourly candle close above the 80,000.00 level.
Technical Targets: This would pave the way for a deeper positive correction, targeting the 81,468.88 level, followed by an approach toward the first weekly resistance level at 83,705.80.
Risk Management:
During periods of sharp declines and high negative momentum in cryptocurrency markets, avoid entering trades indiscriminately. It is essential to strictly adhere to rigorous capital management rules, limiting risk to a maximum of 2% per trade. Furthermore, ensure that stop-loss orders are placed with precision to protect your portfolio against sudden, severe reversals and volatility.
Price Action on the Bitcoin Daily Chart:
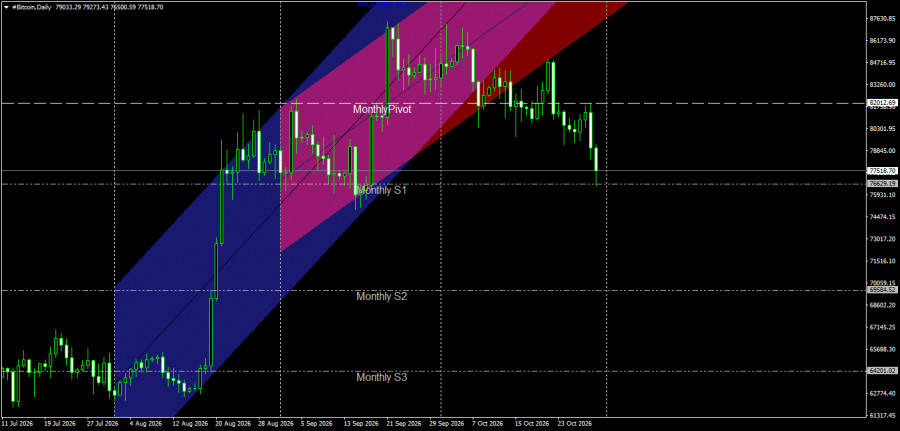
The price is currently trading at 77,518.70, below the descending channel on the daily timeframe. It has experienced a sharp decline and intense selling pressure, falling beneath key pivot levels—specifically the monthly pivot point at 82,012.69.
Analysis of the Last Two Candles (Yesterday's and Today's):
Yesterday's Candle: Reflected immense selling pressure and a violent drop that broke through significant support levels, bringing the price very close to the first monthly support (Monthly S1) at 76,629.19.
Today's Candle: Indicates a continuation of negative momentum, with the price attempting to consolidate below current levels amid clear dominance by the bears (sellers).
Outlook for Future Movement:
Bearish Scenario (Primary): This remains highly probable as long as the price stays below the monthly pivot point and nearby resistance levels. The decline is likely to continue, targeting a test of the first monthly support (Monthly S1) at 76,629.19—with the potential for further downward movement should this support level be broken.
Bullish Scenario (Alternative): This would be triggered if significant buying power emerges, successfully lifting the price and initiating a corrective rebound toward testing nearby resistance levels.
ForexMart is authorized and regulated in various jurisdictions.
(Reg No.23071, IBC 2015) with a registered office at First Floor, SVG Teachers Co-operative Credit Union Limited Uptown Building, Corner of James and Middle Street, Kingstown, Saint Vincent and the Grenadines
Restricted Regions: the United States of America, North Korea, Sudan, Syria and some other regions.








 コンタクトする