Scheduled Maintenance
Scheduled maintenance will be performed on the server in the near future.
We apologize in advance if the site becomes temporarily unavailable.
On Monday, the EUR/USD currency pair showed a slight decline followed by a relatively strong rise. The dollar's strengthening was much less than many traders had expected. Recall that on Saturday night, Donald Trump ordered a strike on Iran's nuclear facilities and later declared their total destruction. Notably, U.S. Vice President J.D. Vance expressed doubt that these facilities were "completely destroyed." However, whether they were destroyed or not is less important. What matters is that the U.S. has officially entered the war. Such an event promised traders a "roller coaster" in the forex market.
However, no such roller coaster was seen—the market moved calmly on Monday, albeit in both directions. The macroeconomic background from the EU and Germany, in the form of business activity indices in the services and manufacturing sectors, played no role, and the June figures turned out rather "bland." The dollar gained slightly during the day but immediately ran into the 1.1460 level, which it had previously failed to break after 4–5 attempts. Of course, this doesn't mean the level will never be broken. But let's face it—even with strong background factors (FOMC meeting, Middle East geopolitics), the U.S. dollar barely added 150 pips. We believe a new uptrend is in the making. In the past week, the EUR/USD movement has also strongly resembled a flat trend, again pointing to the market's reluctance to buy the dollar under any circumstances.
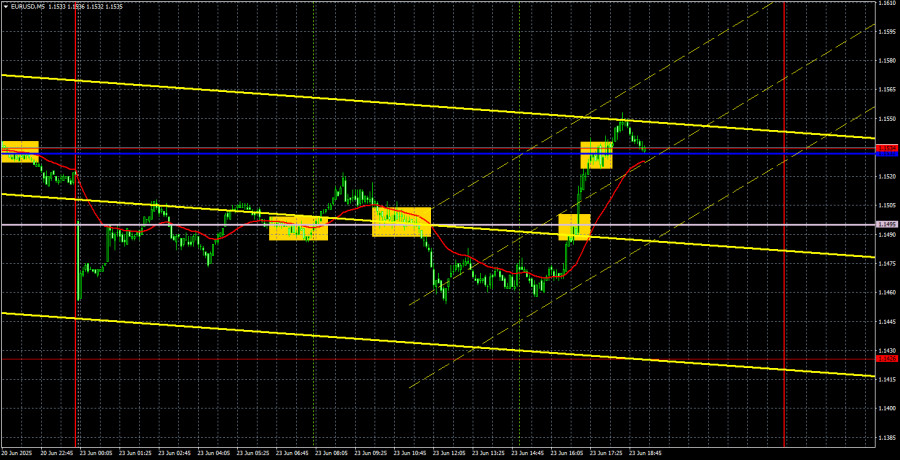
In the 5-minute timeframe, Monday produced four trading signals, which left much to be desired. The price first rebounded from the Senkou Span B line and then broke through it from top to bottom. In both cases, movement in the correct direction was weak. Therefore, the first two signals can be considered false, and the third and fourth weren't worth acting upon due to such "whipsaw" behavior.
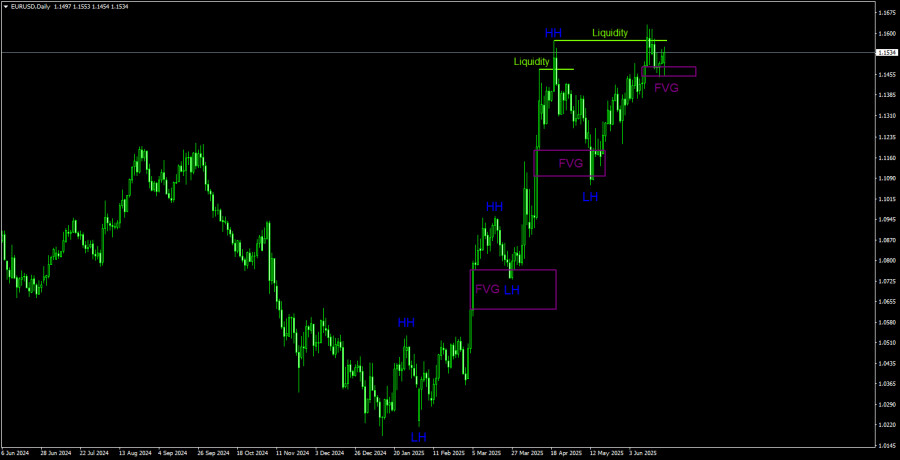
In the long term, we see a clear upward trend. Of course, every bullish trend ends eventually, but the only sign of a possible decline is a liquidity grab from the last higher high (HH). A bullish Fair Value Gap (FVG) zone is a potential bullish signal. A rebound from this area indicates a resumption of euro growth. Considering the market's complete unwillingness to buy the dollar, the bullish trend structure will likely remain relevant for quite some time. Therefore, any short-term dollar strength will likely not significantly affect the prevailing trend. The broader fundamental backdrop continues to weigh against the U.S. dollar.
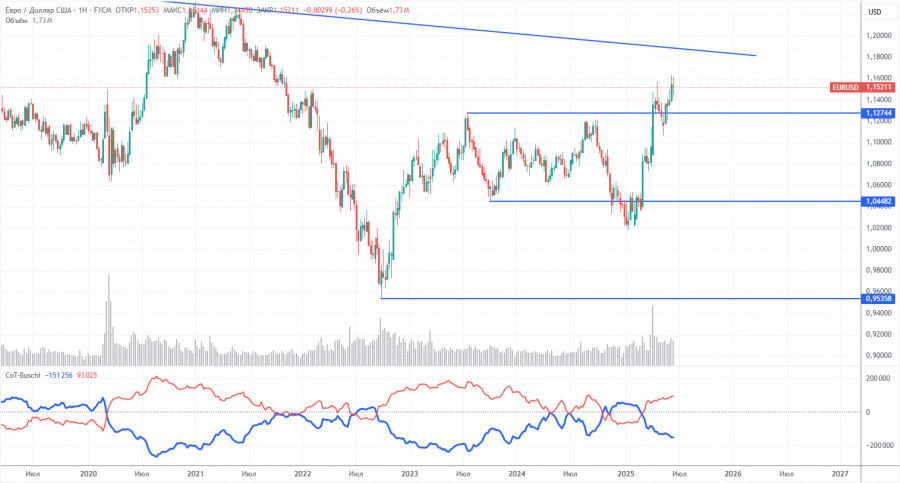
The most recent COT report is dated June 10. The chart above shows that the net position of non-commercial traders has long been bullish. Bears gained the upper hand briefly at the end of 2024 but quickly lost it. Since Trump assumed the presidency, only the dollar has been falling. We cannot say with 100% certainty that the dollar will continue to fall, but current global events suggest this scenario is likely.
We still see no fundamental reasons for the euro to strengthen. However, there is a powerful fundamental reason for the dollar to decline. The global downtrend remains intact—but what relevance does the past 16 years of price action have now? Once Trump ends his trade wars, the dollar could begin to rise. But will Trump ever end them? And when?
The red and blue lines have crossed again, signaling a renewed bullish trend. During the latest reporting week, the number of longs held by the "Non-commercial" group increased by 6,000, and the number of shorts decreased by 4,300. As a result, the net position rose by 10,300 over the week.
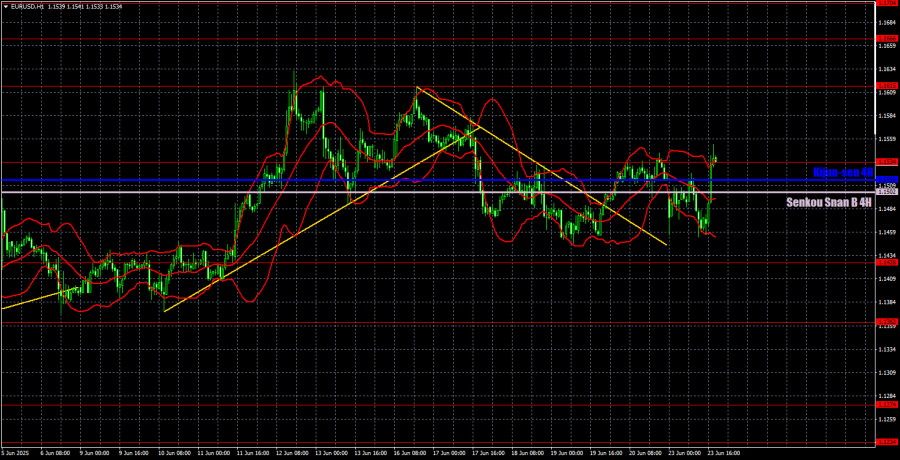
In the 1-hour timeframe, EUR/USD started and completed a short-term downtrend. The pair rebounded on the daily chart from the FVG area, so a renewed rally is likely soon. The U.S.'s official entry into war with Iran didn't support the dollar as many expected. From a technical standpoint, the probability of growth is now much higher.
For June 24, the following levels are highlighted for trading: 1.1092, 1.1147, 1.1185, 1.1234, 1.1274, 1.1362, 1.1426, 1.1534, 1.1615, 1.1666, 1.1704, 1.1750, as well as the Senkou Span B (1.1502) and Kijun-sen (1.1515) lines. Note that Ichimoku lines may shift during the day, which should be considered when identifying trade signals. Don't forget to set a Stop Loss to breakeven if the price moves 15 pips in the right direction. This helps protect against potential losses if the signal turns out to be false.
No major reports are scheduled in the EU or the U.S. on Tuesday. However, Fed Chair Jerome Powell and ECB President Christine Lagarde are set to speak during the day. We don't expect them to provide the market with any new or significant information, given that the FOMC meeting, for instance, was just held last week. There's simply no new data to report.
Scheduled maintenance will be performed on the server in the near future.
We apologize in advance if the site becomes temporarily unavailable.
ForexMart is authorized and regulated in various jurisdictions.
(Reg No.23071, IBC 2015) with a registered office at First Floor, SVG Teachers Co-operative Credit Union Limited Uptown Building, Corner of James and Middle Street, Kingstown, Saint Vincent and the Grenadines
Restricted Regions: the United States of America, North Korea, Sudan, Syria and some other regions.


 コンタクトする