The EUR/USD currency pair attempted to enter a new phase of downward movement on Wednesday, but technical factors prevented it. Throughout the day, there were no significant reports in the Eurozone or the US. As a result, the euro's decline in the first half of the day was due to technical factors. In the second half of the day, the price rose on a rebound from the Senkou Span B line, a strong, significant trend-defining line. By the end of the day, the price was again near the 1.1604-1.1615 area, while the fundamental and macroeconomic background continued to have no impact on the pair's movement.
From a fundamental perspective, we continue to expect growth from the pair. While macroeconomic factors might theoretically provoke declines, the fundamentals clearly point upward. In recent months, market volatility has been very low, and the daily timeframe remains flat. However, even within this flat, one can expect growth, as the price recently approached the lower boundary of the sideways channel 1.1400-1.1830.
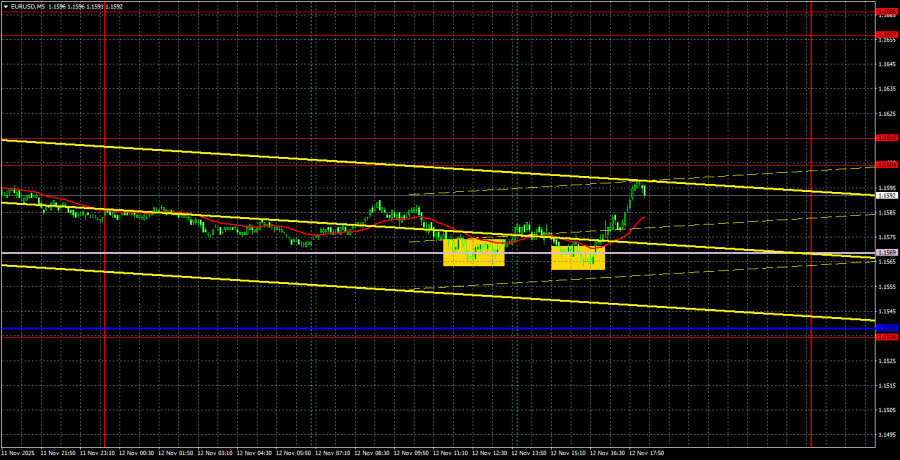
On the 5-minute timeframe, two trading signals were formed yesterday. The price bounced twice from the Senkou Span B line, and these signals duplicated each other. Thus, traders could open a single trading position based on these signals and, by evening, secure profits near 1.1604-1.1615. It is worth noting that volatility remained extremely low, so even 20 pips of profit is considered a gain at this time.
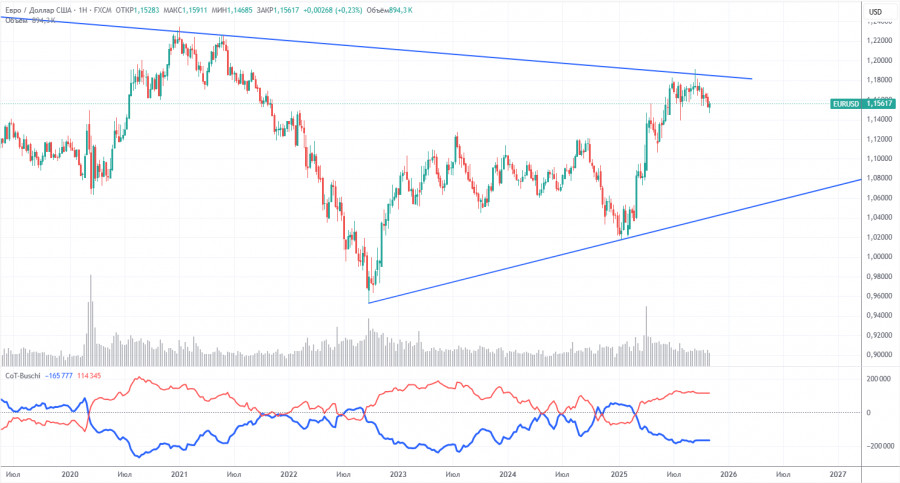
The latest COT report is dated September 23. Since then, no further COT reports have been published due to the U.S. "shutdown." In the illustration above, it is clear that the net position of non-commercial traders has long been "bullish," with bears struggling to gain the upper hand at the end of 2024 but quickly losing it. Since Trump took office for a second term as President of the U.S., the dollar has been falling. We cannot assert that the decline of the American currency will continue with 100% probability, but current world events suggest that this may be the case.
We still do not see any fundamental factors that would strengthen the euro, while there remain sufficient factors that would weaken the dollar. The global downtrend is still ongoing, but what difference does it make where the price moved in the last 17 years? Once Trump concludes his trade wars, the dollar may start to rise, but recent events indicate that the war will continue in one form or another for a long time yet.
The position of the red and blue lines of the indicator continues to indicate the preservation of a "bullish" trend. During the last reporting week, the number of long positions in the "Non-commercial" group decreased by 800, while the number of shorts increased by 2,600. Consequently, the net position decreased by 3,400 contracts over the week. However, this data is already outdated and holds no significance.
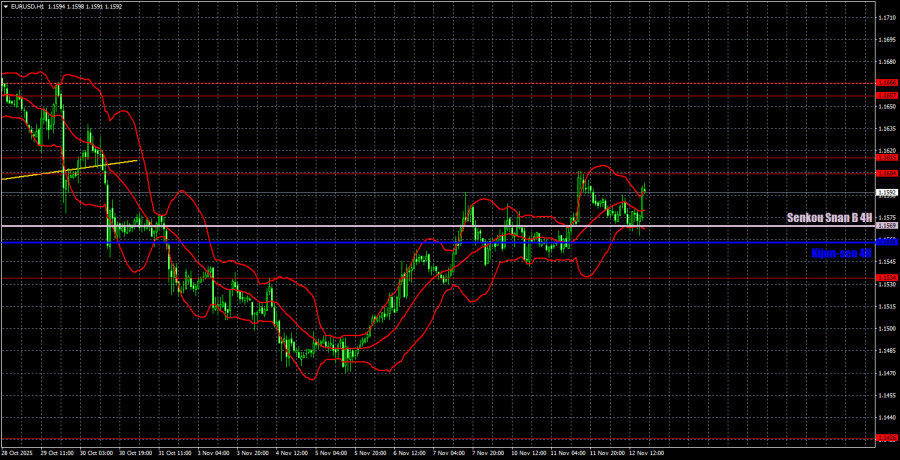
On the hourly timeframe, the EUR/USD pair finally shows signs of starting an upward trend. The Senkou Span B line has been crossed, indicating a high probability of a shift to the upside. We believe the main reason for the inadequate and illogical movements in recent times is the flatness on the daily timeframe—and this flatness persists. As the price approaches the lower boundary of the sideways channel, a local upward trend is expected on the hourly timeframe shortly.
For November 13, we highlight the following trading levels: 1.1234, 1.1274, 1.1362, 1.1426, 1.1534, 1.1604-1.1615, 1.1657-1.1666, 1.1750-1.1760, 1.1846-1.1857, 1.1922, 1.1971-1.1988, as well as the Senkou Span B line (1.1569) and Kijun-sen line (1.1558). The Ichimoku indicator lines may move throughout the day, which should be taken into account when determining trading signals. Don't forget to set your stop-loss order to breakeven if the price moves in the right direction by 15 pips. This will protect against possible losses if the signal turns out to be false.
On Thursday, one event is scheduled for both the Eurozone and the US—the EU industrial production report. This report is certainly interesting, but how strong a market reaction can it provoke, given the current volatility levels? By 20 pips? Technical factors are currently of much greater significance.
On Thursday, traders can expect continued growth, as the price remains above the Senkou Span B line. A rebound from the 1.1604-1.1615 area will allow for short positions, but we would advise against rushing into them, as the trend is currently shifting upward. Overcoming the area of 1.1604-1.1615 will allow for the opening of new long positions with a target of 1.1657.

QUICK LINKS
ForexMart is authorized and regulated in various jurisdictions.
(Reg No.23071, IBC 2015) with a registered office at First Floor, SVG Teachers Co-operative Credit Union Limited Uptown Building, Corner of James and Middle Street, Kingstown, Saint Vincent and the Grenadines
Restricted Regions: the United States of America, North Korea, Sudan, Syria and some other regions.


 Contact Us