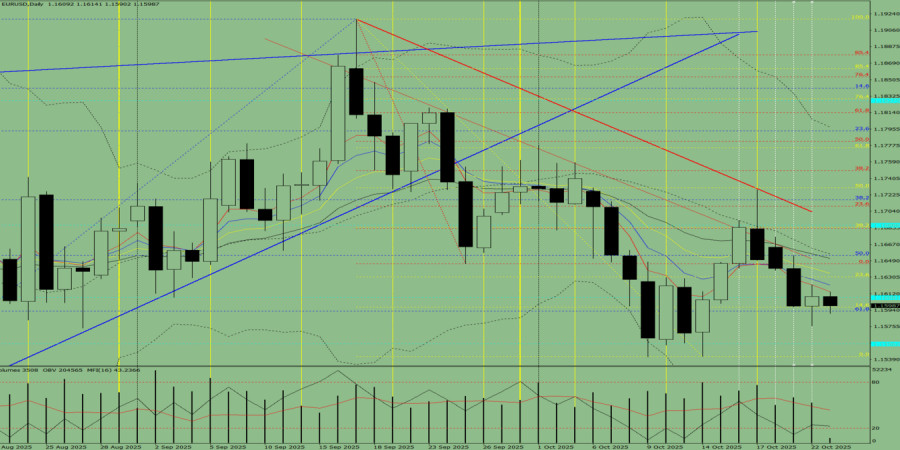
Fig. 1 (Daily Chart)
Overall conclusion: downward trend.
Alternative Scenario
On Thursday, the market may continue moving down from the 1.1609 level (the closing price of yesterday's daily candle) toward the 1.1593 level – the 61.8% retracement level (blue dotted line). Upon testing this level, the price may rebound upward toward 1.1609 – a historical resistance level (light blue dotted line).

QUICK LINKS
ForexMart is authorized and regulated in various jurisdictions.
(Reg No.23071, IBC 2015) with a registered office at First Floor, SVG Teachers Co-operative Credit Union Limited Uptown Building, Corner of James and Middle Street, Kingstown, Saint Vincent and the Grenadines
Restricted Regions: the United States of America, North Korea, Sudan, Syria and some other regions.


 Contact Us