The EUR/USD currency pair recovered slightly on Monday after last week's sharp decline. The week began with news that Iran attacked a nuclear power plant in the UAE, and the UAE promised to retaliate. However, around midday, it became known that Washington had softened its demands on Tehran and is now willing to agree to a 20-year moratorium on uranium enrichment, export 400 kg of already enriched uranium outside of Iran, and temporarily lift sanctions on Iranian oil. As a result, the market gained some optimism, and the euro and British pound slightly improved their positions. Recall that last week, the market was engulfed by a wave of pessimism. Traders sharply stopped believing in a potential agreement, forgetting that statements from Trump should be divided by eight, or better yet, by ten. As experience shows, geopolitics can change direction rapidly, so it is unwise to draw hasty conclusions.
From a technical standpoint, the downward trend is still intact, but if Iran and the US resume negotiations this week, the dollar could fall just as quickly as it rose last week. Unfortunately, geopolitics once again dictates much of the movement in the currency market.
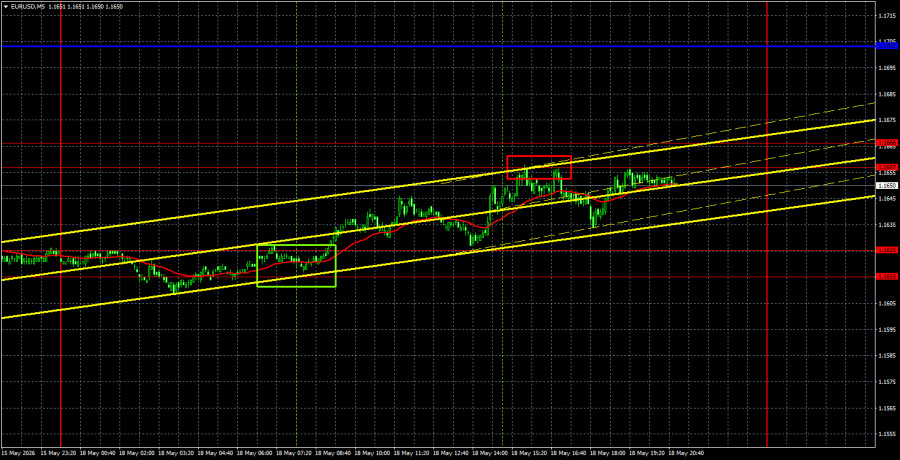
In the 5-minute timeframe on Monday, two trading signals formed, but volatility remained low. At the beginning of the European trading session, the pair bounced off the area of 1.1615-1.1625, and at the beginning of the American session, it worked through the area of 1.1657-1.1666 and bounced off it again. Thus, traders had the opportunity to execute two trades, at least one of which proved profitable.
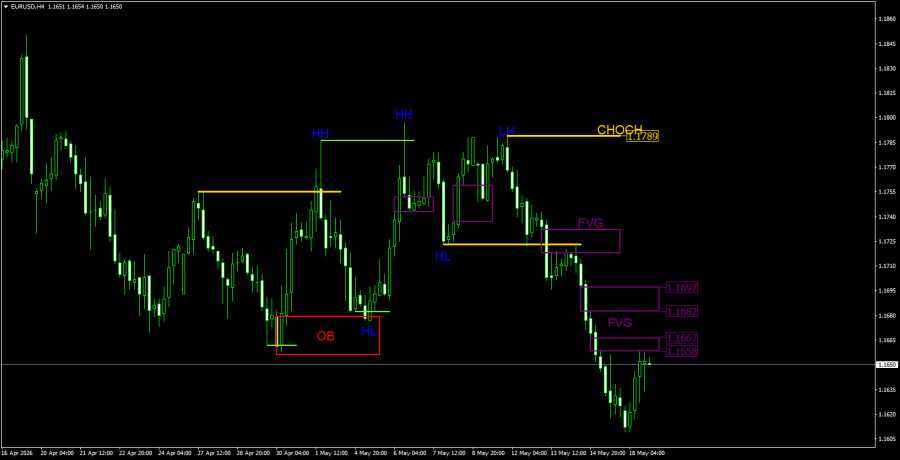
On the 4-hour timeframe, according to the ICT trading system, the situation was favorable for traders on Monday. For most of the day, the pair was correcting within a new downward trend, and by the end of the day, it managed to work through the nearest POI area for sales—the bearish FVG at 1.1658-1.1667. Consequently, a new sell signal may form within this FVG. However, if the geopolitical situation continues to improve this week, it will be extremely difficult for the dollar to maintain its upward momentum. The correction could simply be slightly extended toward the second bearish FVG in the area of 1.1682-1.1697. Thus, at this time, we expect new sell signals to form and will closely monitor the geopolitical situation.
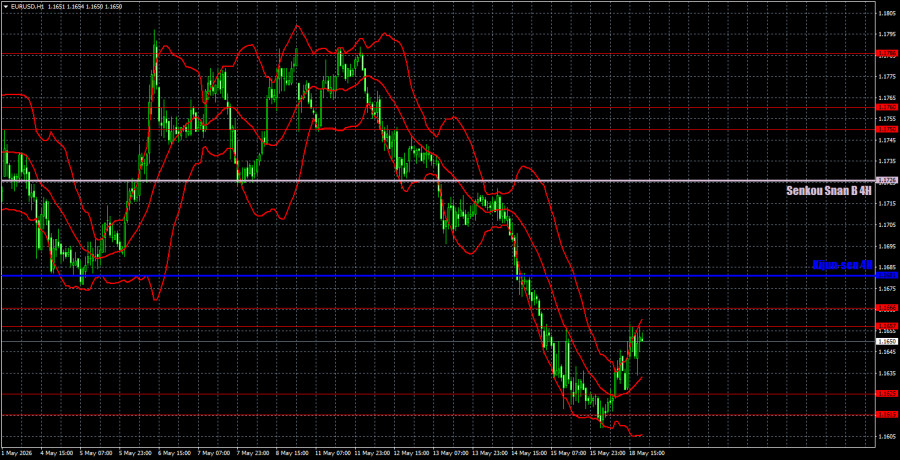
On the hourly timeframe, the EUR/USD pair continues to form a new downward trend. The situation in the Middle East remains tense, with no signs of improvement, but the negotiations have once again stalled, allowing the dollar to show restrained growth. In the near future, the pair's movements will depend on geopolitical factors. If no new signs of escalation in the Middle East emerge, the dollar will begin to lose its ground.
For May 19, we highlight the following trading levels: 1.1362, 1.1426, 1.1542, 1.1615-1.1625, 1.1657-1.1666, 1.1750-1.1760, 1.1786, 1.1830-1.1837, 1.1907-1.1922, as well as the Senkou Span B line (1.1726) and Kijun-sen (1.1681). The Ichimoku indicator lines may shift during the day, which should be taken into account when determining trading signals. Remember to set the Stop Loss order to breakeven if the price moves 15 pips in the correct direction. This will protect against potential losses if the signal turns out to be false.
On Tuesday, the US will release the weekly ADP report on the labor market, while the Eurozone's event calendar will be completely empty. We do not believe that the US currency will continue to strengthen without negative news regarding the US-Iran confrontation.
Today, traders may open new short positions targeting the area of 1.1615-1.1625 when the price bounces from 1.1657-1.1666. Long positions can be opened if the price consolidates above the 1.1657-1.1666 area, with targets of 1.1681 and 1.1726. On the 4-hour timeframe, to open new short positions, a signal in one of the two bearish FVGs is required.
RYCHLÉ ODKAZY
ForexMart is authorized and regulated in various jurisdictions.
(Reg No.23071, IBC 2015) with a registered office at First Floor, SVG Teachers Co-operative Credit Union Limited Uptown Building, Corner of James and Middle Street, Kingstown, Saint Vincent and the Grenadines
Restricted Regions: the United States of America, North Korea, Sudan, Syria and some other regions.


 Kontaktujte nás