ETF Vanguard Mega Cap Growth [MGK] přitahuje investory svou orientací na největší a nejrychleji rostoucí americké firmy. Tento burzovně obchodovaný fond sleduje index CRSP US Mega Cap Growth, který vyhledává společnosti s extrémně vysokou tržní kapitalizací a zároveň silnými růstovými charakteristikami. Patří mezi ně například vysoký růst zisků, efektivní využití aktiv nebo aktivní investiční strategie. Na první pohled jde o lákavý mix – investice do silných lídrů trhu, kteří dominují v období růstu. Jenže právě tento přístup nese i svá úskalí, která je třeba dobře chápat, než se rozhodnete do fondu investovat.
Zásadním problémem fondu je jeho koncentrovaná expozice vůči několika málo akciím. Více než třetinu portfolia tvoří pouhé tři společnosti – Apple [AAPL], Microsoft [MSFT] a Nvidia [NVDA] – což výrazně zvyšuje citlivost fondu na vývoj právě těchto akcií. A protože technologický sektor tvoří přibližně 60 % všech aktiv ETF, výkonnost fondu je v podstatě odrazem dění v několika největších firmách z tohoto odvětví.
Tato strategie může být výhodná během býčích trhů, kdy tito technologičtí giganti táhnou celý trh vzhůru. Problém však nastává ve chvíli, kdy se sentiment na trhu otočí. V takovém případě mohou právě megakapitalizace zaznamenat prudké poklesy a kvůli vysoké váze v portfoliu táhnout celý fond dolů. ETF Vanguard Mega Cap Growth se tak může stát mimořádně zranitelným v období tržních korekcí nebo medvědích trendů.

Rok 2025 byl ideálním testem odolnosti investičních strategií. Výkonnost ETF Vanguard Mega Cap Growth během tohoto turbulentního období zaostala za tradičním indexem S&P 500, i když ten je rovněž vážený podle tržní kapitalizace a přirozeně inklinuje k větším firmám. Ještě výraznější rozdíl pak ukázal Invesco S&P 500 Equal Weight ETF, který každé akcii v indexu přiděluje stejnou váhu. Díky tomu fond lépe diverzifikuje rizika a v roce 2025 si vedl nejlépe ze všech tří sledovaných možností.
To potvrzuje základní pravidlo diverzifikace – přílišná expozice na několik největších firem může být v době poklesů na škodu. I když je ETF Vanguard v dlouhodobém horizontu výkonný a pravidelně své složení rebalancuje čtvrtletně, v krátkodobých výkyvech může být více náchylný ke ztrátám.
Znamená to, že by se investoři měli ETF Vanguard Mega Cap Growth vyhýbat? Ne nutně. Fond nabízí atraktivní možnost, jak investovat do růstových gigantů, a jeho historické výsledky jsou působivé – zejména v obdobích býčího trhu. Klíčové je ale vědět, co skutečně vlastníte, a jaká rizika s tím souvisejí.
Investor by měl zvážit, zda je připraven vydržet i období, kdy se technologický sektor dostane pod tlak. Pokud ne, může být rozumnější kombinovat tento ETF s jiným fondem s vyrovnanějším portfoliem. Tím lze vyvážit potenciální ztráty a snížit volatilitu. Takový přístup může zajistit, že během poklesů nebude mít investor v portfoliu jen jeden dominantní zdroj ztrát, ale i stabilnější složku, která pomůže zmírnit dopady negativních tržních trendů.
Závěrem lze říci, že Vanguard Mega Cap Growth ETF představuje atraktivní investiční nástroj pro ty, kdo věří v dlouhodobou sílu a růst největších amerických společností, zejména v technologickém sektoru. Fond nabízí přímou expozici vůči lídrům trhu, jako jsou Apple, Microsoft a Nvidia, což v dobách ekonomické expanze může přinášet velmi zajímavé výnosy. Historie výkonnosti fondu tuto tezi potvrzuje. Zároveň je však nutné zdůraznit, že podobně jako všechny investice založené na vysoké koncentraci, nese i tento ETF zvýšenou míru rizika – zejména v obdobích tržních korekcí nebo přechodu do medvědího trendu.

Rok 2025 ukázal, že právě tato koncentrace může být ve volatilním prostředí značnou nevýhodou. Naopak více diverzifikované fondy, jako je Invesco S&P 500 Equal Weight ETF, nabídly investorům větší stabilitu. Investoři by proto neměli vsázet vše na jednu kartu a měli by zvážit doplnění portfolia o vyváženější ETF, které lépe zvládají poklesy.
Klíčem k úspěchu je porozumění rizikům a správná kombinace strategií. Vanguard Mega Cap Growth ETF může být silným pilířem portfolia – pokud víte, co od něj čekat.
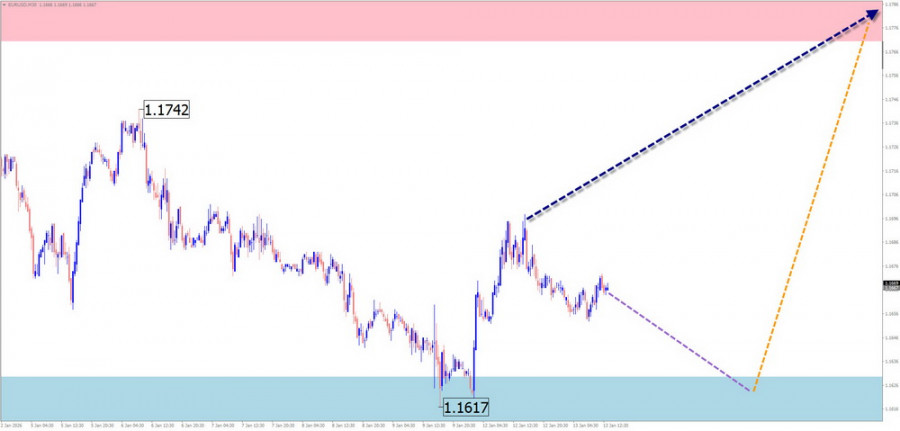
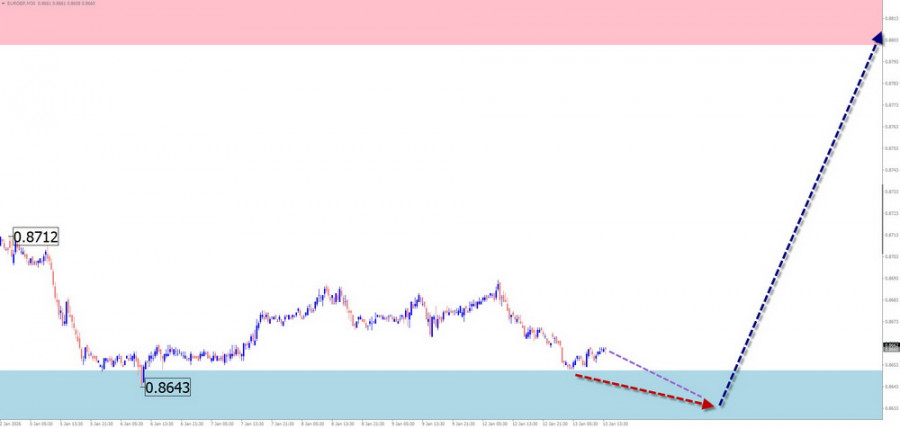
EUR/USD
Within the broader bullish wave of the euro major, which has been unfolding since the beginning of last year, the pair's quotes have spent the past six months moving along the lower boundary of a strong potential reversal zone. At the time of analysis, the wave structure does not appear complete. Over the past three weeks, a corrective pullback to the downside has been developing.
In the near term, continued sideways movement of the euro is expected. Following a probable attempt to test the lower reversal zone, a change in direction and a rise toward the resistance area may occur. During the directional shift, a brief break below the lower boundary of the projected support cannot be ruled out.
Resistance:
Support:
Sell positions: fairly risky and may lead to deposit losses.Buy positions: may become viable after confirmed reversal signals appear on the trading systems you use near the support area.
USD/JPY
Since October of last year, the Japanese yen major has mostly been moving higher, forming an extended ascending flat. The wave structure lacks its final segment (C). In recent weeks, a corrective pullback has been forming from an intermediate resistance zone, predominantly in a sideways manner.
Over the coming week, there is a high probability that the overall sideways price movement will persist. In the first few days, short-term pressure on the resistance zone is possible, after which a change in direction and the start of a decline may follow. The support area marks the lower boundary of the pair's preliminary weekly range.
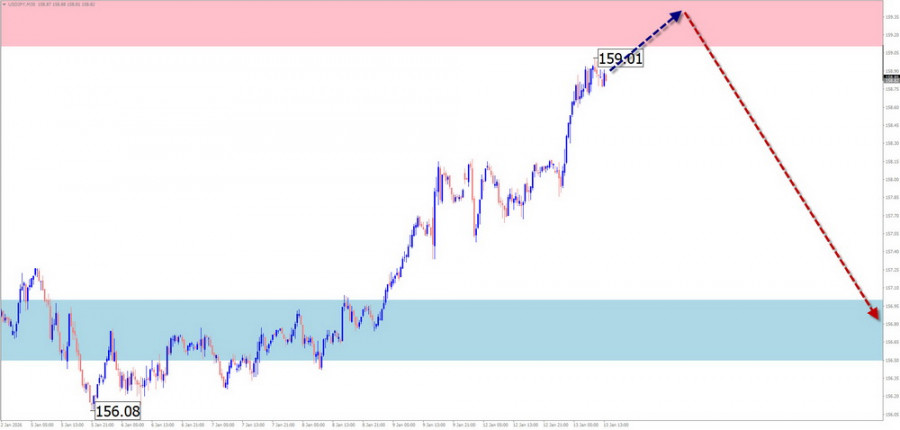
Resistance:
Support:
Buy positions: fairly risky and may result in deposit losses.Sell positions: after confirmed reversal signals appear, small position sizes may be used to seek profits.
GBP/JPY
On the GBP/JPY pair chart, the short-term trend direction has been defined by a bullish wave that began on November 5 of last year. This price segment completes a larger-scale wave structure. At present, the price has reached the lower boundary of a strong potential reversal zone on a higher timeframe.
During the current week, the ongoing upward price movement is expected to complete. Before a trend reversal, pressure on the upper boundary of the resistance zone is possible over the next couple of days. An increase in volatility and the start of an active price decline are more likely toward the end of the week.
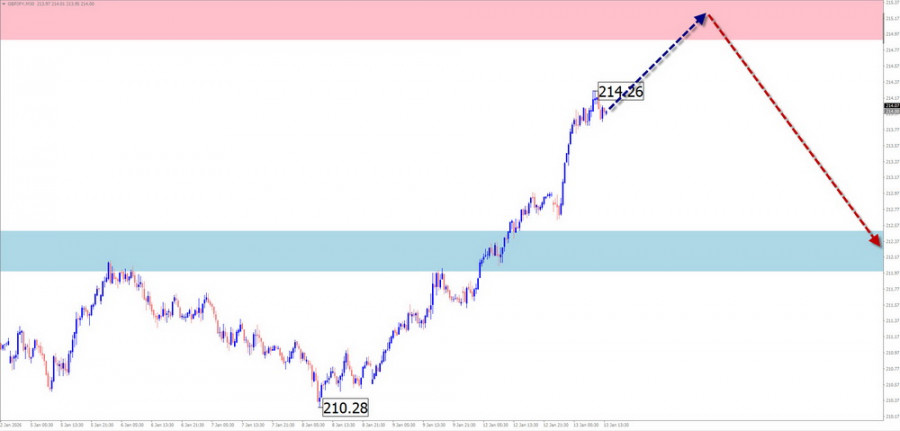
Resistance:
Support:
Buy positions: risky and may be unprofitable.Sell positions: may be used after appropriate reversal signals appear near the resistance area.
USD/CAD
The primary direction of price fluctuations in the Canadian dollar major has been defined by a descending wave algorithm since February of last year. The unfinished segment of the main trend began on November 5. Since late December, a counter-wave structure has been developing, remaining within corrective boundaries.
At the beginning of the upcoming week, there is a high probability that the overall sideways price bias will persist. Pressure on the upper boundary of the projected resistance cannot be ruled out. With high probability, a reversal may then form, followed by a price decline toward the support zone.
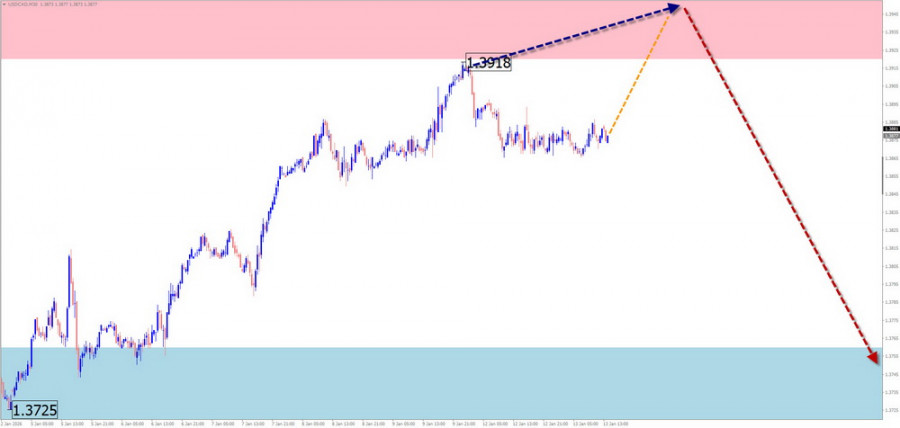
Resistance:
Support:
Buy positions: have limited potential and carry a high level of risk.Sell positions: may become viable after appropriate reversal signals appear near the resistance area on the trading systems you use.
EUR/GBP
The current wave structure of the EUR/GBP pair is bearish and has been unfolding since April of last year. Since October, the pair has been trading in a range, forming the initial phase of the final wave segment (C). Quotes are confined to a narrow channel between strong potential reversal zones on the daily timeframe.
In the coming days, continued sideways movement can be expected. Near the support zone, a reversal is likely to form, followed by a resumption of upward movement. The highest activity is most likely closer to the weekend.
Resistance:
Support:
Buy positions: may be opened in fractional size after reversal signals appear near the support zone. Upward potential is limited by the resistance area.Sell positions: unpromising and risky.
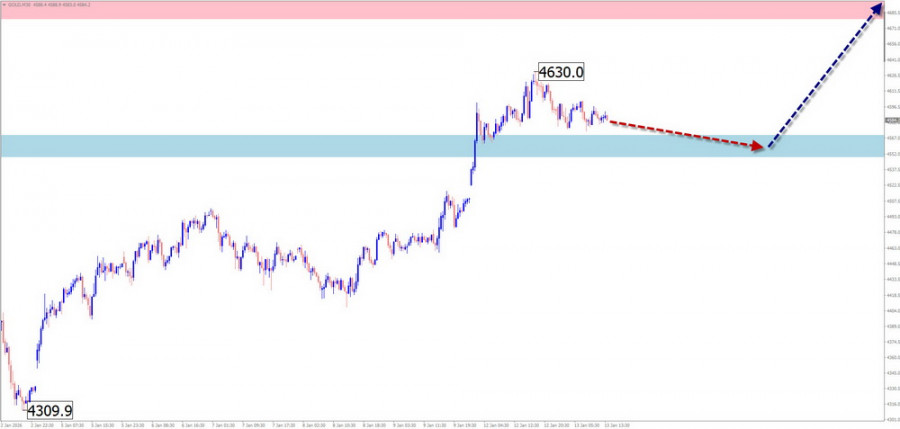
Gold
Gold prices are renewing the record highs seen at the end of last year. Within a larger wave structure, following a hidden correction, this segment has initiated another trend phase. A corrective pullback in the form of an extended flat is currently forming and remains unfinished at the time of analysis.
Over the coming week, there is a high probability that the overall sideways price bias will persist. In the first few days, pressure on the lower boundary of the support zone is possible. Thereafter, with high probability, a reversal may form, followed by the start of a decline. The expected downside range is capped by the projected resistance.
Resistance:
Support:
Buy positions: have limited potential and carry a high level of risk.Sell positions: may become viable after appropriate reversal signals appear near the projected support zone on the trading systems you use.
Explanations
In simplified wave analysis (SWA), all waves consist of three segments (A–B–C). On each timeframe, the most recent unfinished wave is analyzed. Dotted lines indicate expected price movements.
The wave algorithm does not take the duration of price movements over time into account.
RYCHLÉ ODKAZY
ForexMart is authorized and regulated in various jurisdictions.
(Reg No.23071, IBC 2015) with a registered office at First Floor, SVG Teachers Co-operative Credit Union Limited Uptown Building, Corner of James and Middle Street, Kingstown, Saint Vincent and the Grenadines
Restricted Regions: the United States of America, North Korea, Sudan, Syria and some other regions.


 Kontaktujte nás