
At a monetary policy meeting yesterday, the Bank of England raised interest rates by 25 basis points to 4.25%, the highest rates since October 2008. Back then, interest rates were at 4.50%. The increase came due to persistent inflation. In February and January, consumer prices accelerated to 10.4% and 10.1% respectively. Meanwhile, economists had expected inflation to slow down in February. However, the latest press release hints at a possible end of the tightening cycle in the near term. So, it may be that we will soon see the regulator pause tightening.
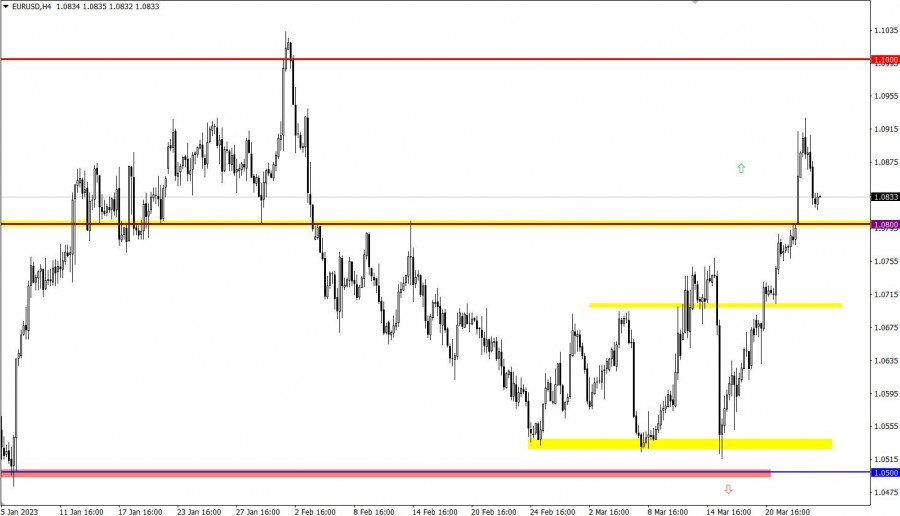
EUR/USD has gained over 250 pips since the beginning of the week. That triggered a horizontal movement with a signal to buy EUR. The volume of long positions decreased and the price retreated.
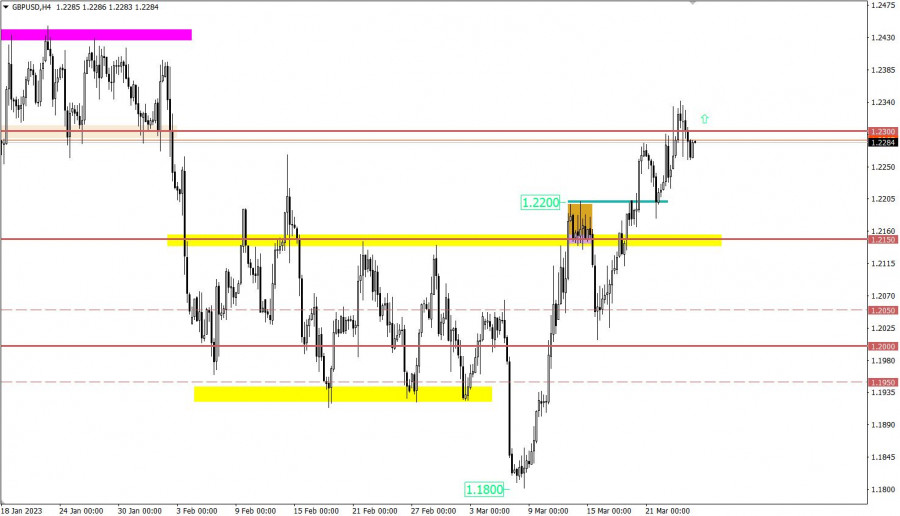
Once 1.2300 resistance was reached, GBP/USD pulled back somewhat. Nevertheless, the bull trend goes on. The pound has recouped almost all losses incurred in February.
With the opening of European trade, UK retail sales came in, showing a rise to -3.5% versus -5.4% year-on-year. On a monthly basis, figures grew by 1.2%.
Today, a series of business activity reports will be delivered in the eurozone, the United States, and the United Kingdom. Economists expect figures to decline across the board.
EUR/USD retreated to 1.0800 support. The price may rebound from this mark with a rise in buying volumes.
Alternatively, EUR/USD may go down if quotes stay below 1.0800 intraday.
A pullback may cause a shift in sentiment. Should the price go above 1.2300, it would generate a signal to buy GBP. This could lead to a bullish continuation, and the pair could update the swing high of the medium-term trend.
Alternatively, if quotes fall below 1.2200, it will mark the rise of a downtrend.
The candlestick chart shows graphical white and black rectangles with upward and downward lines. While conducting a detailed analysis of each individual candlestick, it is possible to notice its features intrinsic to a particular time frame: the opening price, the closing price, and the highest and lowest price.
Horizontal levels are price levels, in relation to which a stop or reversal of the price may occur. They are called support and resistance levels.
Circles and rectangles are highlighted examples where the price reversed in the course of its history. This color highlighting indicates horizontal lines which can exert pressure on prices in the future.
Upward/downward arrows signal a possible future price direction.
ForexMart is authorized and regulated in various jurisdictions.
(Reg No.23071, IBC 2015) with a registered office at First Floor, SVG Teachers Co-operative Credit Union Limited Uptown Building, Corner of James and Middle Street, Kingstown, Saint Vincent and the Grenadines
Restricted Regions: the United States of America, North Korea, Sudan, Syria and some other regions.


 联系我们
联系我们