The EUR/USD currency pair traded very sluggishly for most of the day on Wednesday. This is not particularly surprising, as there were no significant events or reports scheduled for yesterday. We mentioned that the second estimate of inflation in the Eurozone carries little weight, and the FOMC minutes are even less relevant, as they are published three weeks after the actual meeting, making the information they contain outdated by the time they are released.
As a result, the market once again had nothing to react to yesterday, and over the past few months, it has shown no desire to take the initiative. All analysis of the pair's movements now boils down to two points: volatility and flat conditions on the daily chart. These two concepts are interconnected, and it can be said that without one, there would be no other. Volatility is declining in both the short- and long-term. Thus, with each passing day, the market is trading less actively. What could this be attributed to? It is evident to all market participants that the fundamentals and macroeconomics are not to blame. Yes, we have not seen any important labor and unemployment reports in the U.S. for the past month and a half, but has that stopped the Federal Reserve from holding its meetings? On the contrary, the last two Fed meetings made "dovish" decisions, which have not hindered the dollar's growth.
And what about the "shutdown"? Can it really be considered an ordinary event? What about various other reports and events in the world, particularly in the U.S.? Didn't Donald Trump introduce new tariffs in October? However, volatility continues to decline, and market movements remain illogical. There can be only one explanation for this: the flat state. Many traders view the flat as a coincidence. Many believe that a flat forms due to the absence of news or significant events. This is a major mistake. The flat forms for entirely different reasons.
Let us recall that all movements of any instrument can be conditionally divided into trends and flats. As we all know, large players—market makers—dominate the market. Thus, periods of flat are characterized by the accumulation or distribution of positions by market makers. A trend is the realization of established deals. Simply put, large capital first accumulates its positions, and then movement begins when liquidity is insufficient to meet demand or supply.
Therefore, the current flat on the daily timeframe is neither a coincidence nor a result of a weak news background. It represents the planned actions of major players. When they have fully established their positions, the trend will begin. We still believe that the trend is upward because it is extremely difficult to say why anyone would buy the dollar at this time. Consequently, in the current situation, the only option is to wait and... also accumulate positions. As the price approached the lower boundary of the flat—the 1.1400 level—this presents a good opportunity for long-term positions now.
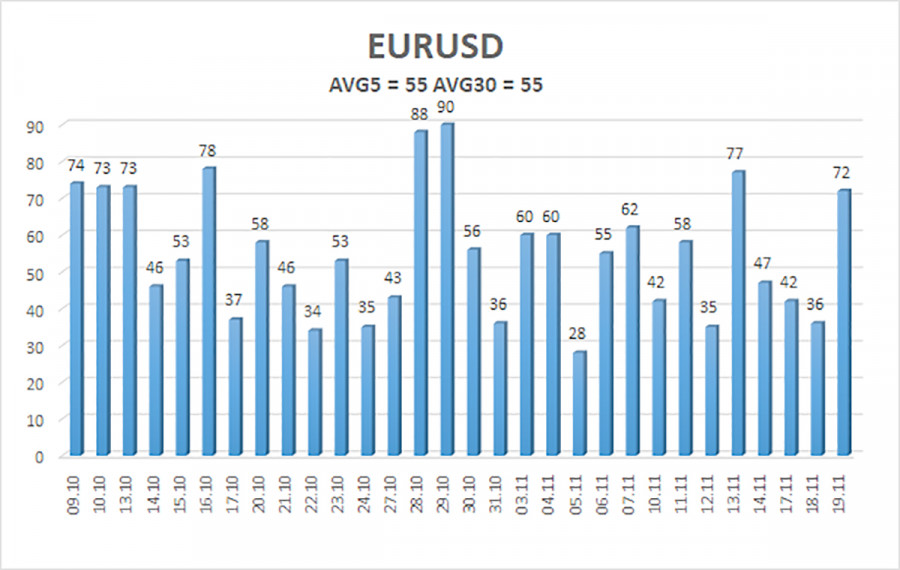
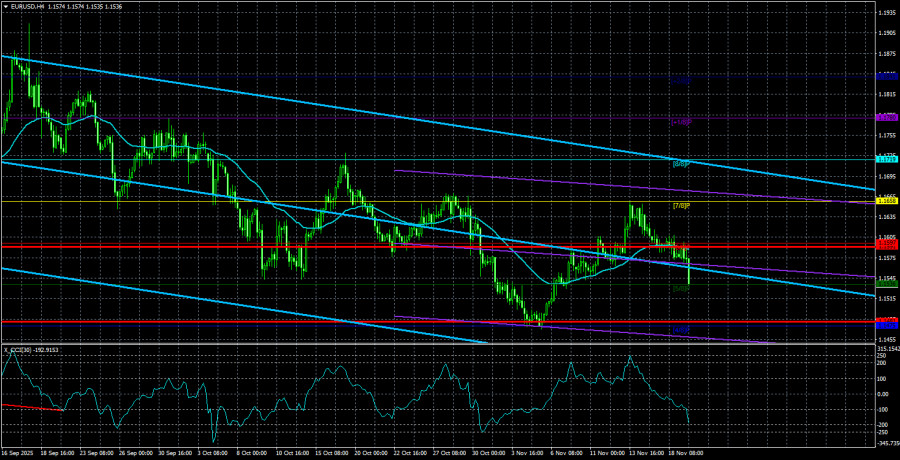
The average volatility of the EUR/USD currency pair over the last five trading days as of November 20 is 55 pips, which is considered "average." We expect the pair to trade between 1.1481 and 1.1591 on Thursday. The upper channel of the linear regression points downward, signaling a downward trend, but in fact the flat continues on the daily timeframe. The CCI indicator has entered the oversold area twice in October, which may provoke a new upward trend in 2025. In the near future, the indicator may enter the oversold territory for the third time.
The EUR/USD pair has once again settled above the moving average, maintaining an upward trend on all higher timeframes, while a flat has persisted on the daily timeframe for several months. The U.S. dollar remains strongly influenced by global fundamental factors. Recently, the dollar has risen, but the reasons for this movement may be purely technical. If the price is below the moving average, small short positions can be considered targeting 1.1481 on purely technical grounds. Above the moving average, long positions remain relevant with a target of 1.1800 (the upper line of the flat on the daily timeframe).
ForexMart is authorized and regulated in various jurisdictions.
(Reg No.23071, IBC 2015) with a registered office at First Floor, SVG Teachers Co-operative Credit Union Limited Uptown Building, Corner of James and Middle Street, Kingstown, Saint Vincent and the Grenadines
Restricted Regions: the United States of America, North Korea, Sudan, Syria and some other regions.


 আমাদের সাথে যোগাযোগ করুন