
The GBP/USD currency pair experienced growth on Monday, coinciding with the start of the U.S. trading session. It's important to note that this growth did not stem from any specific economic event, nor was it linked to Donald Trump's inauguration, as the upward movement began at a different time. At one point, the dollar started to decline, raising questions about the reason behind this shift.
We are not fans of such unpredictable movements, which are often difficult to explain even in hindsight. The market tends to react emotionally during these moments, disregarding analysis and logic. It appears that a major market participant began closing their dollar positions, resulting in the U.S. currency's weakening. The reasoning behind this decision is known only to that participant. After all, what significance does Donald Trump's inauguration hold? It merely formalizes the transition from one president to another. This change has been public knowledge for two months, giving the market ample time to react to the event and the statements made by Trump.
We believe that the pound sterling will primarily rely on standard technical corrections, which can be extensive and prolonged. It's important to note that trending phases generally last much shorter than corrective phases. In practice, this manifests as the market taking a long time to accumulate positions for buying or selling, which appears on charts as corrections, consolidations, or flat movements. This accumulation is followed by a primary movement characterized by a sharp and rapid increase in demand or supply, leading to further market reactions.
On the daily timeframe, it's evident that the pound has experienced nearly four months of decline with virtually no corrections. Consequently, a prolonged period of growth may be on the horizon, although it is unlikely to be strong or swift. For the British currency, the first target is the Kijun-sen line at 1.2444. However, we do not expect a quick rise to this level; instead, it's more probable that there will be a rebound followed by a continuation of the decline. As previously mentioned, corrections and consolidations typically require time, and a correction on the daily timeframe, for example, could last for a couple of months.
In terms of the fundamental context, it's important to separate the topic of Trump's inauguration from the broader landscape, as it fundamentally does not bring any immediate changes. We can only evaluate the future prospects of the dollar and the U.S. economy once we see tangible changes from the Trump administration. At present, no sanctions have been implemented, tariffs are still mere threats, and while the idea of "closed borders" may attract voters, its actual implementation will be quite challenging. Therefore, we do not expect any rapid changes that could lead to market turmoil. Additionally, there are no long-term reasons for the pound sterling to appreciate, just as there were none before.

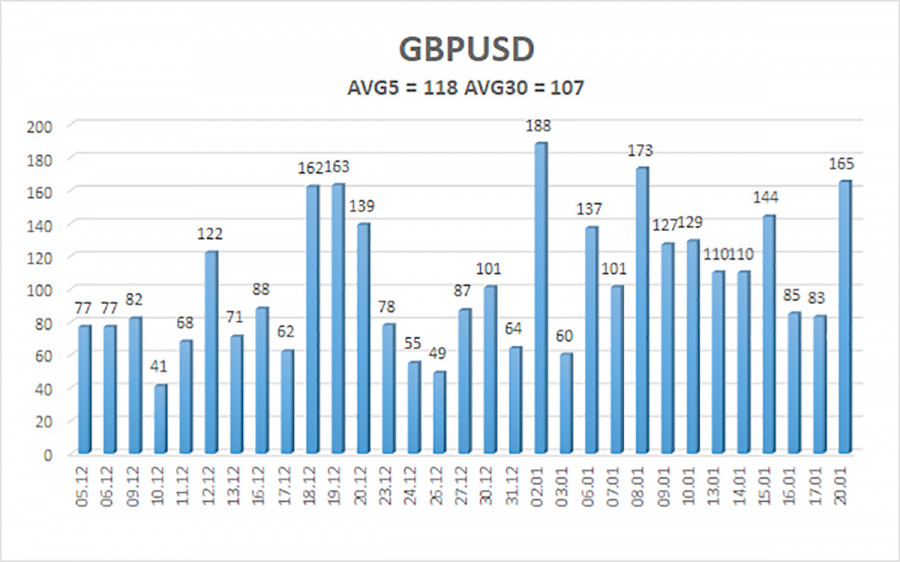
The average volatility of the GBP/USD pair over the last five trading days is 118 pips, considered "high" for this pair. Therefore, on Tuesday, January 21, we expect movement within a range defined by the levels 1.2177 and 1.2413. The upper channel of linear regression remains directed downward, signaling a bearish trend. The CCI indicator has entered the oversold area again, but any oversold condition in a downtrend is merely a signal for a correction. A new bullish divergence from this indicator again hints at a possible correction.
The GBP/USD currency pair maintains a bearish trend. We still do not recommend long positions, as the market has already accounted for all potential growth factors for the British currency multiple times, and no new factors are present. If you trade based on "pure technicals," long positions are possible with targets at 1.2329 and 1.2390, provided the price positions itself above the moving average line. Short positions remain much more relevant, with targets at 1.2146 and 1.2085, but this now requires the pair to consolidate below the moving average again.
Linear Regression Channels help determine the current trend. If both channels are aligned, it indicates a strong trend.
Moving Average Line (settings: 20,0, smoothed) defines the short-term trend and guides the trading direction.
Murray Levels act as target levels for movements and corrections.
Volatility Levels (red lines) represent the likely price range for the pair over the next 24 hours based on current volatility readings.
CCI Indicator: If it enters the oversold region (below -250) or overbought region (above +250), it signals an impending trend reversal in the opposite direction.